


Quarter 3 2023 was quite interesting from a numbers vs general market feel perspective – the market has felt like it has been moving at a slower pace but sales were steady – slightly below the volume of 2022 but not by much. Interest rates are having an impact on volume – especially in the lower priced segments of the market where buyers are more rate impacted. New listings coming to market have been lower in number than 2022 – thoughts on why include sellers not wanting to part with a property that has lower rate financing and buyers not wanting to take on new financing at a higher rate to move into their next property. That being said properties are still moving and median sales prices have actually posted gains in most of our tracked geographic areas. Interest rates are bouncing around – no one is sure what direction they are actually heading in – domestic policy, government spending, international conflict, financial system stability, consumer confidence, Fed policy and moving into an election year all play a role. It’s very complex and there remains a lot of uncertainty as to if rates will continue to climb or level and begin to reduce. However, it seems clear that buyers are getting more used to higher rates and if they come down to 5-6%, there is a good chance the competition for homes will become more fierce.
Single Family
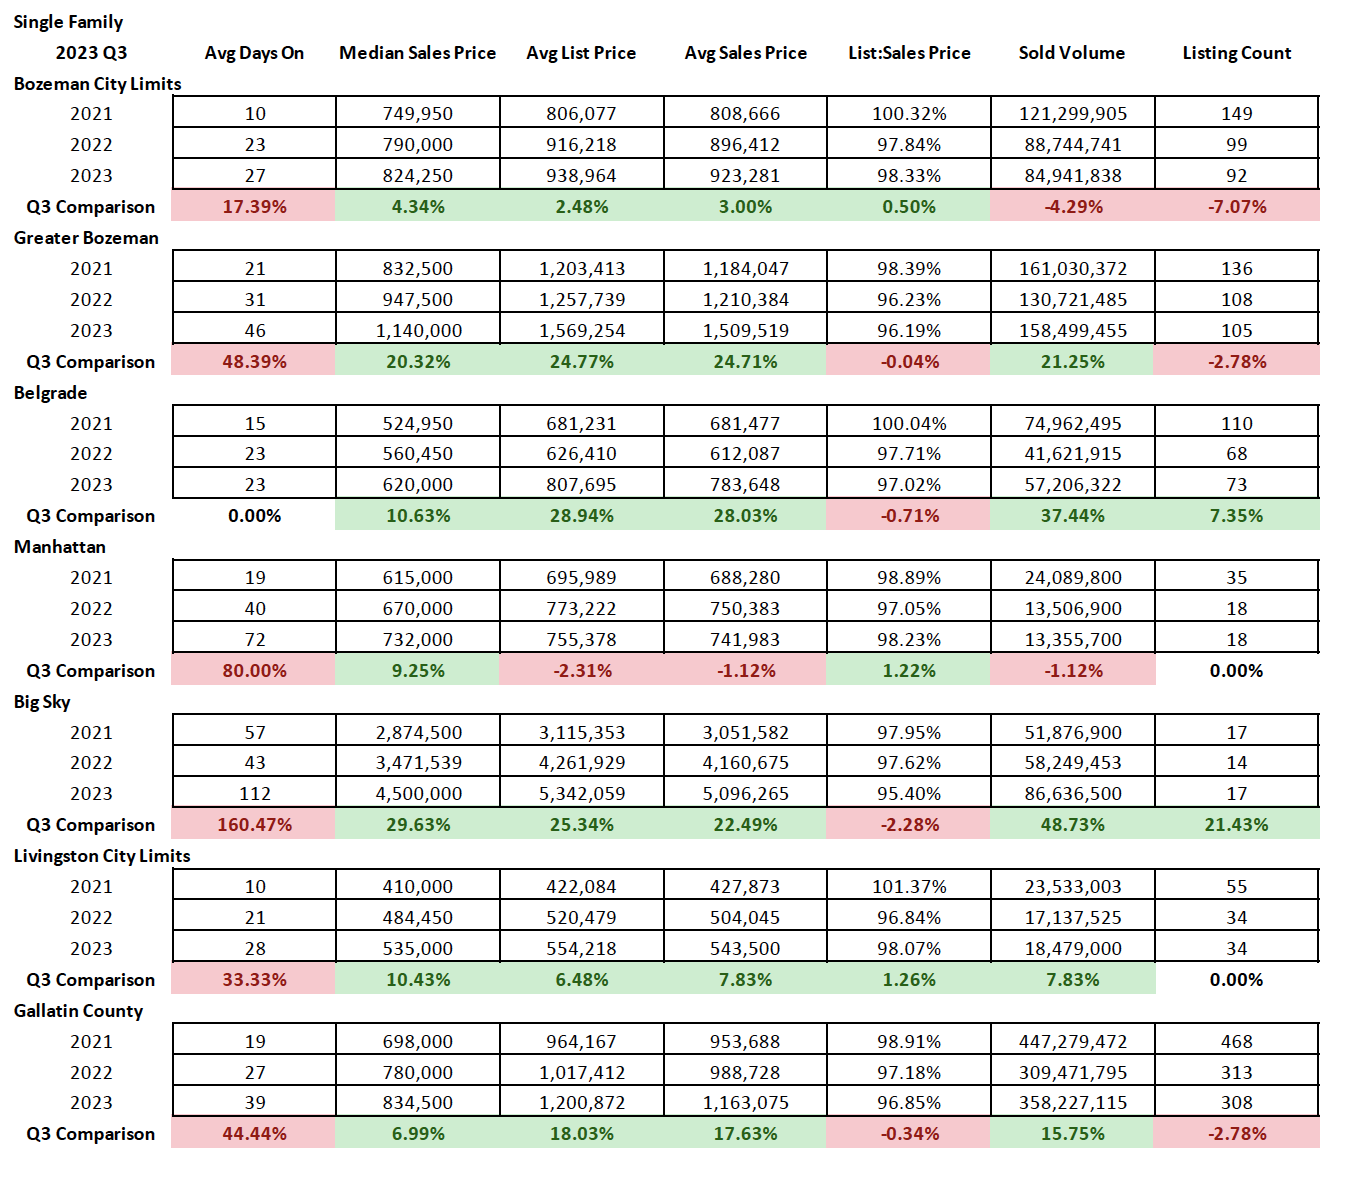
Single family homes have continued to post record median sales price appreciation in many geographic areas tracked. City of Bozeman median sales price settled at $824,250 for Q3 2023 – this is the highest it’s ever been and just slightly higher than what we were considering the ‘peak’ for Pandemic pricing in Q1/Q2 2022. Greater Bozeman hit its 2nd highest peak at $1,140,000 median sales price (all time high at $1,175,000 in Q1 22). Belgrade hit is 3rd highest peak at $620,000 (Q2 2023 was at $630K and Q1 2022 was at $624K). Livingston hit its all-time high at $535K. Big Sky was tied with Q2 2023 for all time high at $4,500,000.
Number of units sold are not far off of last years stats for Q3 2023 – in all areas it was equal to or slightly less units than last year, Q3 2022. The biggest change year over year is that average days on market are elevated in most areas tracked – this is in line with a growing inventory of properties that are experiencing price reductions to attract buyers – a combination of interest rates/overpricing/buyers being more . Average days are ranging from around a month in Belgrade, Livingston and City of Bozeman to 1-2 months in greater Bozeman and Manhattan to closer to 4 months in Big Sky. Of note, there less inventory available on the market, though properties are siting longer, than during Q2 2022.
List to sales price ratios show a balanced market, with some discounting off list prices happening (keeping in mind that there in many cases have been price reductions off of original list price that have not been factored into our stats) – with 2-3% discounting on average in City of Bozeman, Greater Bozeman, Belgrade, Manhattan and Livingston and about 5% on average in Big Sky.
Condos/Townhomes
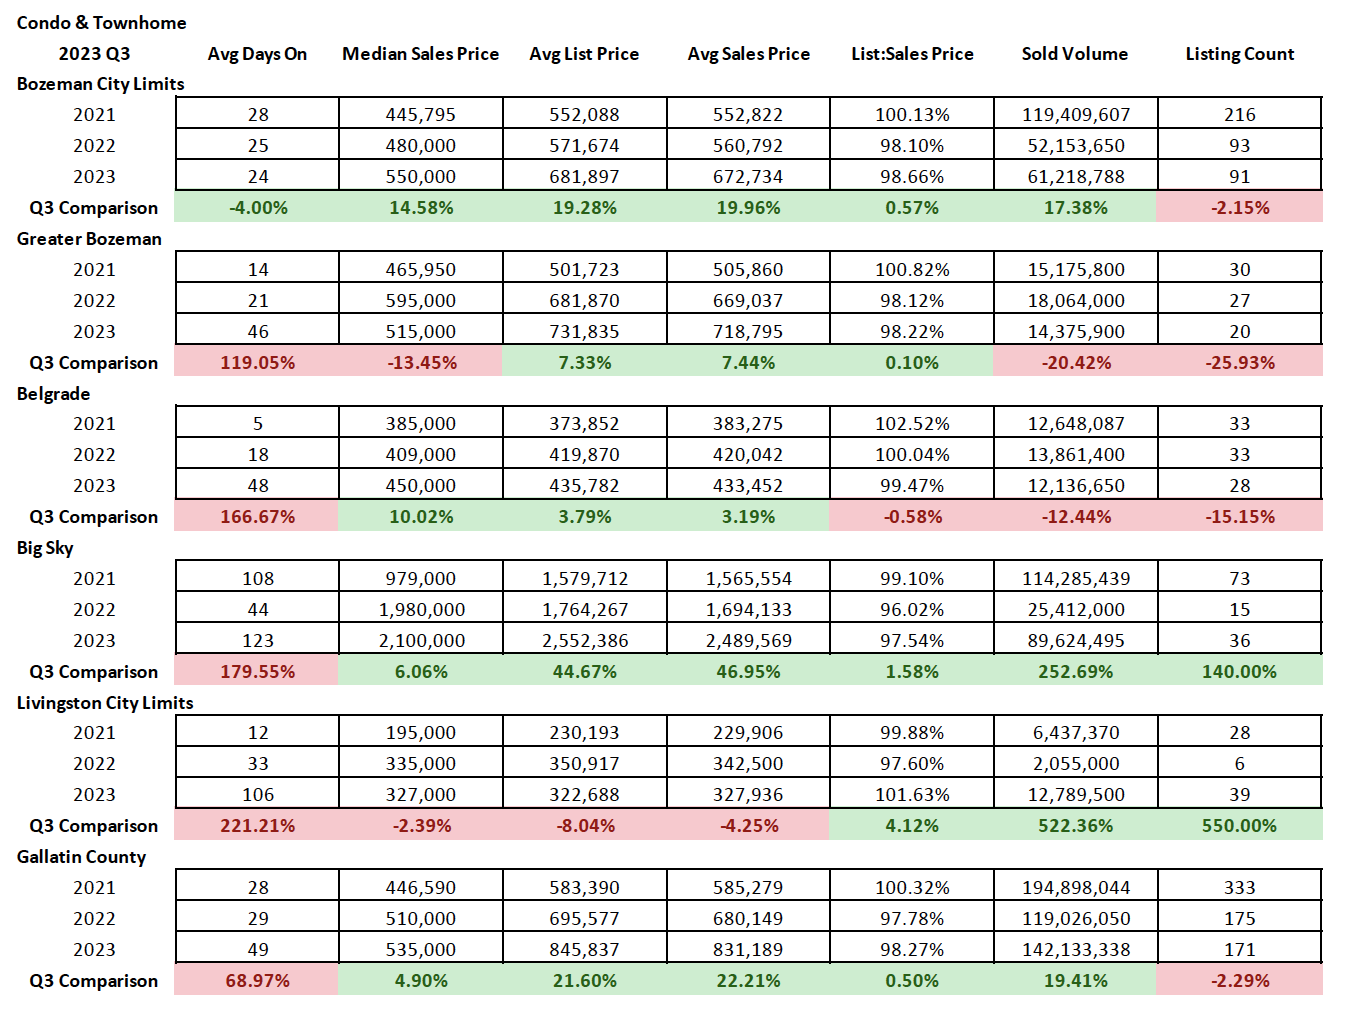
Condo and townhome median sale prices have also continued to post close to record high point appreciation. Median sales price in Bozeman was the 4th highest quarter on record in Q3 2023 at $550K. Belgrade was at 4th highest quarter on record in Q3 2023 at $450K. Greater Bozeman was at 5th highest quarter on record at $515K. Livingston was at 6th highest quarter on record at $327K and Big sky as at 2nd highest quarter on record at $2.1M The prices have bounced around in this general price point since 2022.
Number of units sold was down in some areas and up in others – Livingston, Big Sky had a surge of closings due to closing on a bunch of new construction units that have been in the pipeline for over a year. Number of units sold was flat in City of Bozeman, down 20% in greater Bozeman and down 15% in Belgrade.
Days on market were flat in Bozeman and increased significantly in Belgrade, Big Sky and Livingston. It is typically a month on market in Bozeman, a month and a half in greater Bozeman and Belgrade and four months in Big Sky and Livingston.
List to sales price ratios show a continued balanced market in most areas – with some discounting 1-2% happening in all areas, except for Livingston which saw above list price on average – likely due to the new construction nature of most of the units sold and upgrades made.
Land
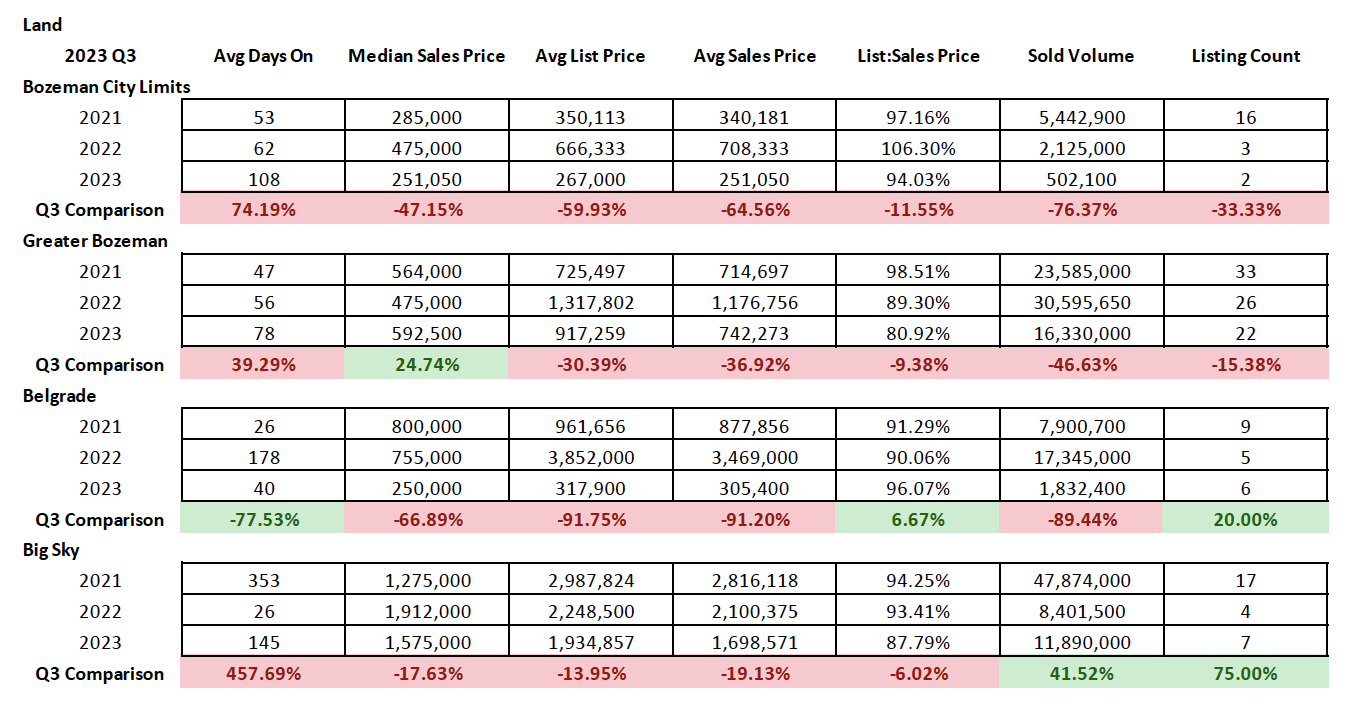
Land has been more temperamental than the other classes, with increasing inventory in most areas and fewer parcels selling. Commercial financed money has been very expensive – this in turn has reduced the number of people taking out lot loans, starting new builds and the number of builders considering building on spec.
Median sales prices were reduced in Bozeman by 47% year over year, partially due to more smaller lots coming to market – only five lots sold in Q3 2022. Belgrade has seen a big reduction in land median pricing due to smaller development lots selling in town on resale. Big Sky had a jump in volume sold but a reduction in median sales price as more inventory stacks up.
Number of units sold was down in Bozeman and Greater Bozeman and up lightly in Belgrade and Big Sky over Q2 2023.
Days on market have increased in all areas but Belgrade (partially thrown off by a large sale there in Q2 2022. Averages for time on market are around 4.5 months in Bozeman, 1.5 months in Belgrade, 2.5 months in Greater Bozeman and 5 months in Big Sky.
List to sales price ratios show more of a buyer’s market for land. Bozeman is showing about a 6% discount on average off list price. Greater Bozeman is about 20% off list price. Belgrade is about 4% off list price and Big Sky is about 13% off list price.
High End & Luxury Single Family
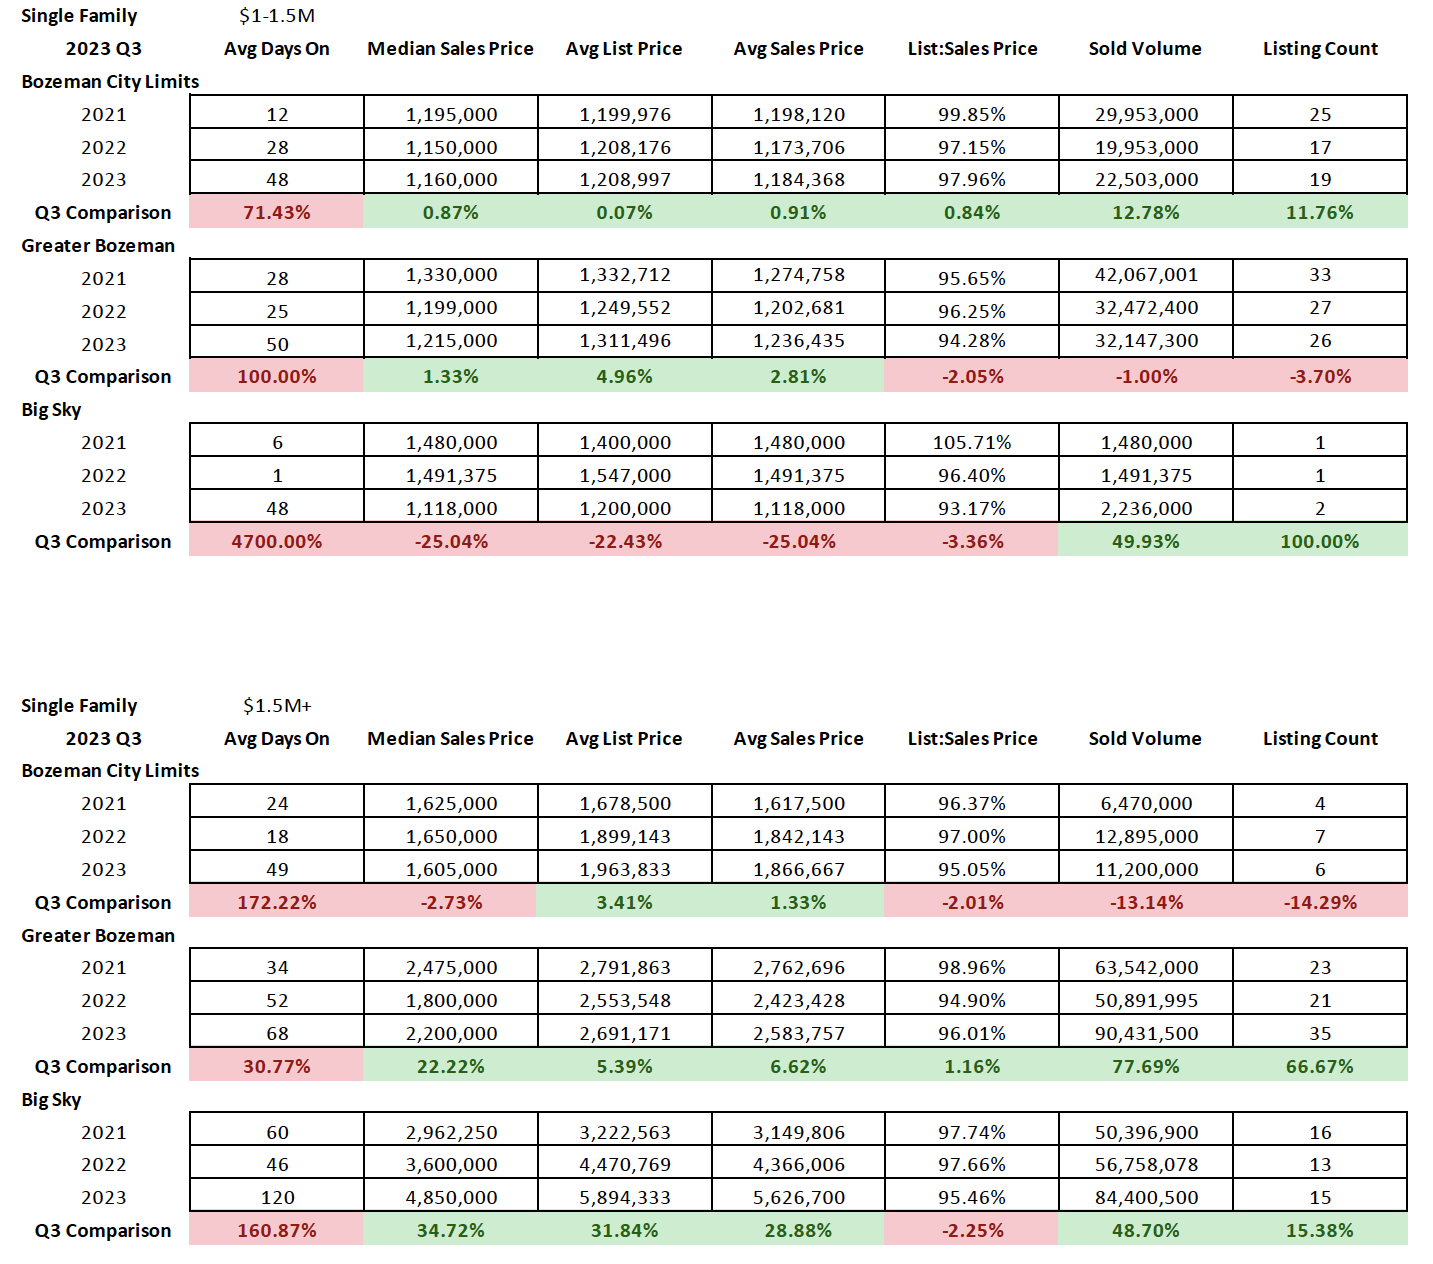
High end single-family home sold listings (those priced $1M-$1.5M) in all areas tracked were flat to slightly improved for the number of units sold Q3 2023 over Q3 2022. This is indicative of this segment of the market’s ability to be as affected by interest rate fluctuations. Days on market have increased to almost 2 months for each of the areas tracked, City of Bozeman, Greater Bozeman and Big Sky. List to sales price ratios show a balanced to slightly tilting buyer’s market with 2% discounting on average off list price in City of Bozeman, 5.75% discounting on average in Greater Bozeman and 7% discounting in Big Sky on average.
Luxury single family homes (those priced over $1.5M) in all areas tracked were flat to improved for number of units sold Q3 2023 over Q3 2022. City of Bozeman was flat. Greater Bozeman had a 66% increase over Q3 2022 and Big Sky had a slight uptick year over year increase over Q3 2022. Average days on market increased in all areas, up to about 2 months in City of Bozeman, Greater Bozeman and now up to 4 months on market in Big Sky. List to sales price ratios show a balanced market, with close to 5% discounting off list price in Q3 2023 in City of Bozeman, 4% discounting off list price in Greater Bozeman and 4.5% discounting off list price in Big Sky.
High End & Luxury Condo and Townhomes
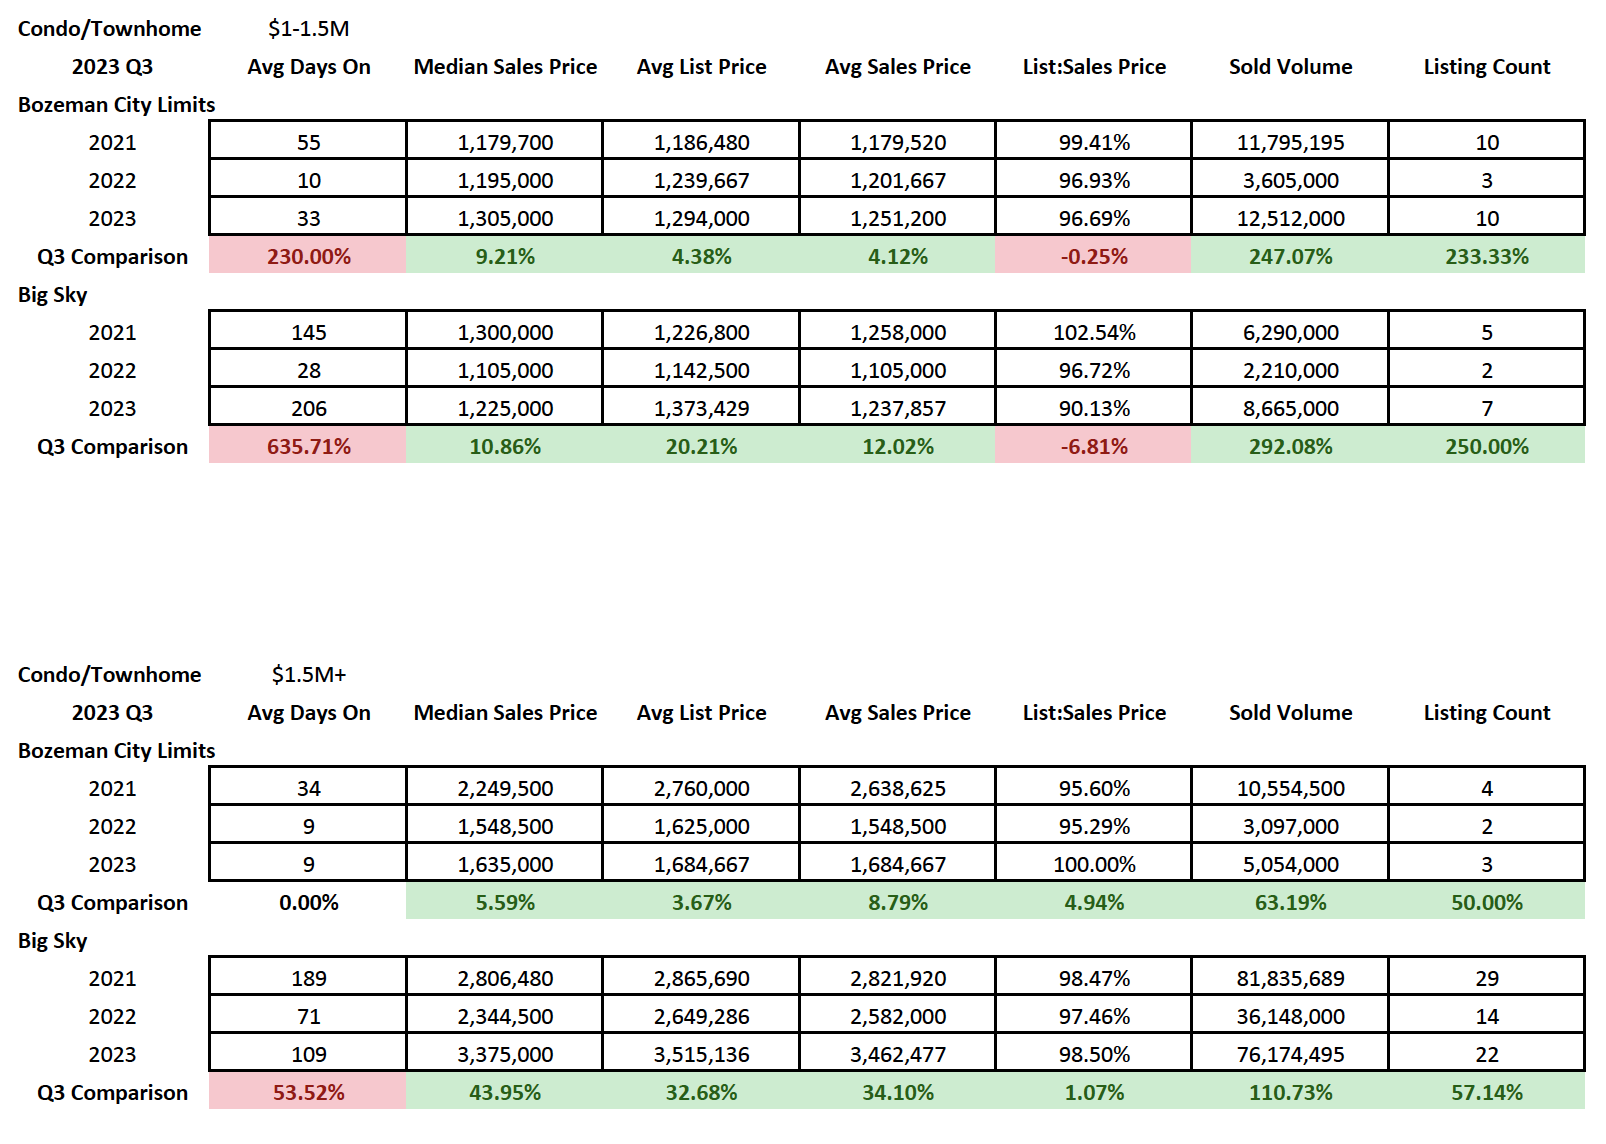
High end condo and townhome sold listings (those priced $1M-$1.5M) in all areas tracked (City of Bozeman and Big Sky) had significantly larger numbers of closings (up 233% in Bozeman and 250% in Big Sky) due to some new construction product and quite a bit of resale. Also very indicative of a segment of the market that is less affected by interest rate fluctuations and increases. Days on market have increased to just over a month in the City of Bozeman and close to 7 months in Big Sky. List to sales price ratios indicate a balanced to buyer’s market, with close to 3.25% discounting off list price in City of Bozeman (balanced) to 10% discounting in Big Sky (buyer’s).
Luxury condo and townhome sold listings (those priced over $1.5M) in all areas tracked (City of Bozeman and Big Sky) increased in number sold in both City of Bozeman (fairly flat but steady with Q3 2022 and Q3 2021 and Big Sky (up 57% over Q2 2022). Days on market are flat in City of Bozeman at just over a week – these are mostly new construction products. Days on market in Big Sky were elevated to just under 4 months. List to sales price ratios show a continued strong seller’s market – with no discounting in City of Bozeman and 1.5% discounting in Big Sky.