


It seems that every news outlet is currently reporting on the fact that interest rates for home loans have gone up. And with a rise in interest rates the real estate market has slowed. But exactly how has it slowed Q4 2022 vs Q4 2021?
According to our analytics, the huge median sales price appreciation experienced during the pandemic (2020-2021) years has not fallen.
However, number of units sold in Q4 2022 was well off of numbers posted in previous years – this is in part due to lack of quality inventory and properties that remain priced too high for the market to bear. Many sellers have placed their homes on the market with expectations of pricing that is too high for what buyers are willing to move forward with. Many properties were priced off the rising market and as the pricing has leveled, these properties were stranded with too high of a listing price. Proactive agents and brokers have educated their clients about the market and the need to stay with the market in their pricing, even if that pricing is lower than it was last spring or early summer.
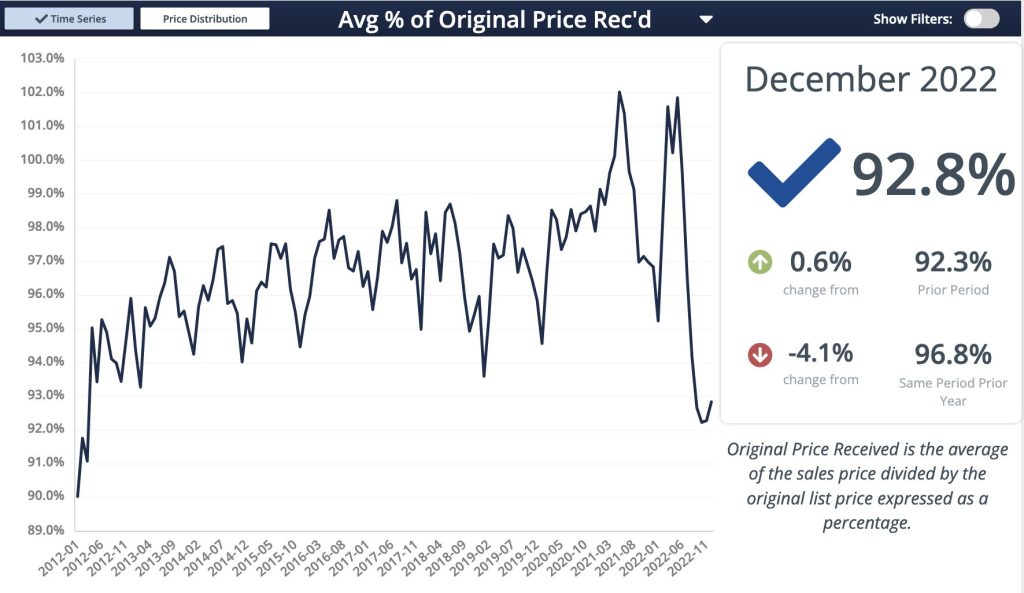
There have been less price reductions recently as new inventory has hit that has been priced more realistically. But price reductions are still common. Buyers have not yet become comfortable with offering much less than list price due to years of having to rise above list price just to get the property. Sellers are many times having to drop their prices to gain buyer attention if they haven’t moved after a bit of time on the market.
Days on market have risen some – but not as high as where they were before the pandemic. These will continue to tick upwards as more inventory hits the market. Average days on market is sitting around one to two months depending on area and what kind of product is being sold.
There have been more expireds and cancellations on listings in the past few months as some sellers feel the need to take properties off the market to ‘wait it out’ (just what they’re waiting for is a question mark – as other than the rates piece, even with eroding appreciation it’s still amazing what prices have done in the past few years) – which has again helped to create more of an inventory vacuum.
List to sales price ratios show increased discounting in all areas tracked with the exception of Big Sky and Livingston. Big Sky showed over list price closed sales on average – this could be skewed due to new construction that has been in the pipeline for months/years finally closing – with upgrades and prior market competition. Discounting in all other areas ranges between 2-5% on average.
Single Family
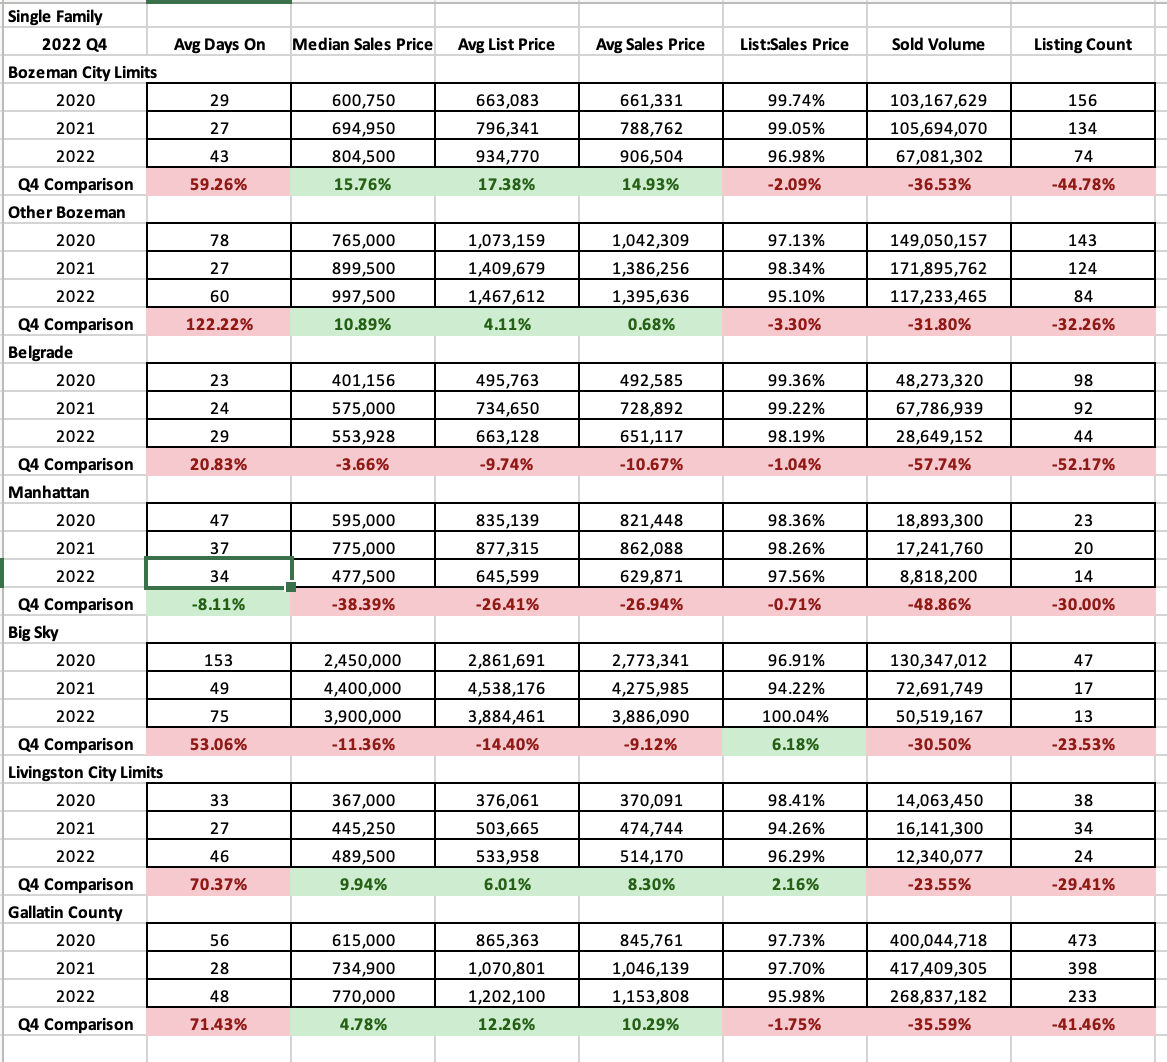
Q4 2022 over Q4 2021 showed increases in Median Sales price in portions of the market and declines in others. This is the first notable quarter with a decline since the great recession and that was in one sector of the market year over year. City of Bozeman was up 16% ($804,500), Greater Bozeman was up 11% ($997,500) and Livingston was up 10% ($490K) – Livingston was likely due to new construction neighborhoods in the area. Belgrade was down 4% ($554K) as construction in many of the new neighborhoods leveled off for the time being. Big Sky was down 11% ($3.9M) and Manhattan was off 39% ($478K) as new construction tapers.
Average days on market have stayed fairly static in Belgrade and Manhattan at about 1 month. Days on market have increased in all other areas ranging from 1.5 months in Livingston and City of Bozeman to two months in Greater Bozeman and close to 2.5 months in Big Sky.
Number of units sold in Q4 2022 were off significantly from Q4 2021. Bozeman was down 45%, Greater Bozeman 33%, Belgrade 52%, Manhattan 30%, Big Sky 24% and Livingston 30%. This was likely a combination of interest rates, lack of quality inventory and a pull back by both hesitant buyers and sellers with a list of reasons not to enter the market.
Condos and townhomes

Q4 2022 was again the 1st significant quarter showing drops in median sales price since the great recession for condos and townhomes. Condos and townhomes showed more adjustment as the lower portion of the market struggles with buyers who are more affected by interest rates which has shrunk the pool significantly. Median sales price Q4 2022 vs 2021 in City of Bozeman dropped 18% ($380K), in greater Bozeman dropped 7% ($475K), but gained ground in Belgrade up 22% ($475K), Big Sky up 37% ($1.57M) and Livingston up 36% ($420K).
List to sales price ratios showed increased discounting in all segments of the condo and townhome markets – most of these areas had above ask averages the past couple of years. Now discounting of 2-3% off list price is commonplace.
Days on market were higher in all areas with a month or less common in City of Bozeman and Livingston, 1.5 months in Belgrade and Greater Bozeman and 5 months in Big Sky.
Number of listings sold were also off significantly Q4 2022 over Q4 2021 – with reductions of 40-50% on average. Livingston was off 90% due to some new construction complexes coming to completion that had higher sales year prior.
Land
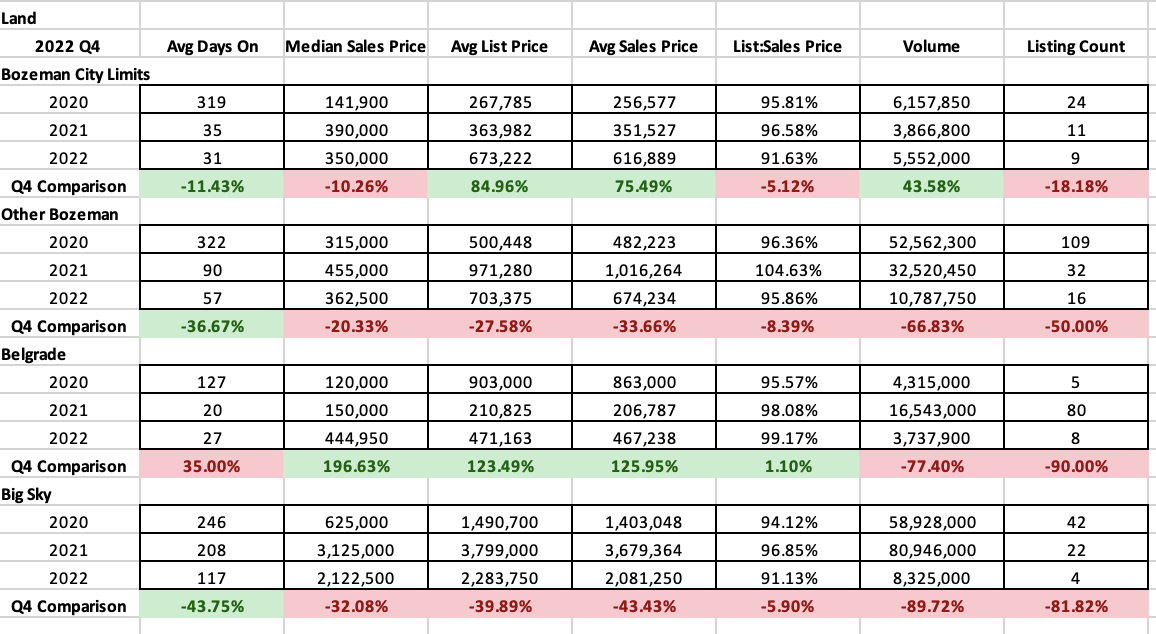
Quarter 4 2022 was down for median sales price in most areas tracked for land sales. Prices dropped 10% in City of Bozeman ($350K), 20% in Greater Bozeman ($363K) and 33% in Big Sky ($2.12M). Belgrade was the only area that rose and it rose significantly as subdivisions with cheaper options have been sold out.
List to sales price ratios showed increased discounting in all areas but Belgrade. Typically discounting is ranging between 5-8%.
Average days on market showed shortened days on market for properties in all areas but Belgrade which was about flat. Average days on market range from 1-2 months in all areas but Big Sky which is closer to 4.5 months.
Number of listings sold was also off, like all other property classes. Listings in Bozeman were only slightly off (9 sales) 2021 numbers but still significantly below 2020 numbers. The trend was the same for Greater Bozeman, Belgrade and Big Sky which ranged from 50-90% less transactions closed.
High End and Luxury
Single Family
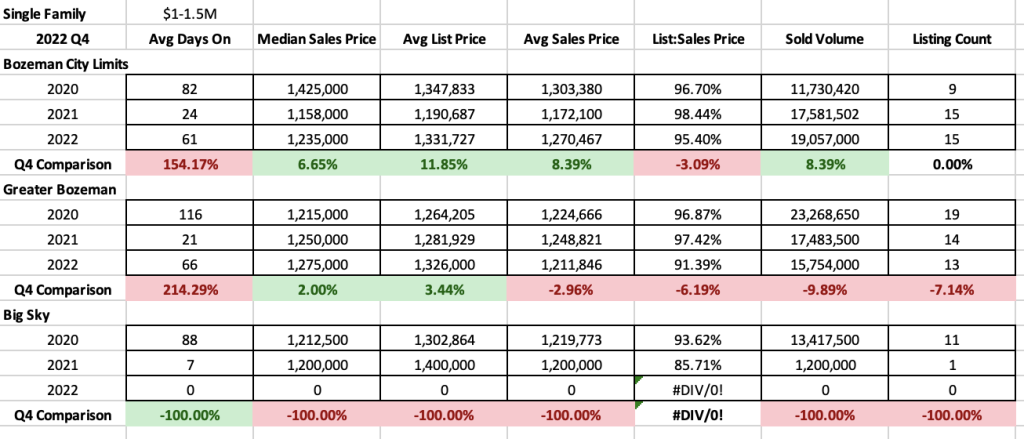
Q4 2022 remained string for High end transactions ($1M-$1.5M) in City of Bozeman and Greater Bozeman – Big Sky jumped out of this price point for Single Family homes with no sales in Q4 2022 as prices soared in this area. Median prices for City of Bozeman and Greater Bozeman rose in this segment of the market over 2021 but dropped from 2020 in City of Bozeman. List to sales price ratios show increased discounting in this segment of the market – with 5% on average in City of Bozeman and 9% on average in Greater Bozeman. Average days on market have spiked up to two months – up from less than 1 month a year ago. Number of listings sold stayed pretty constant though which is interesting.
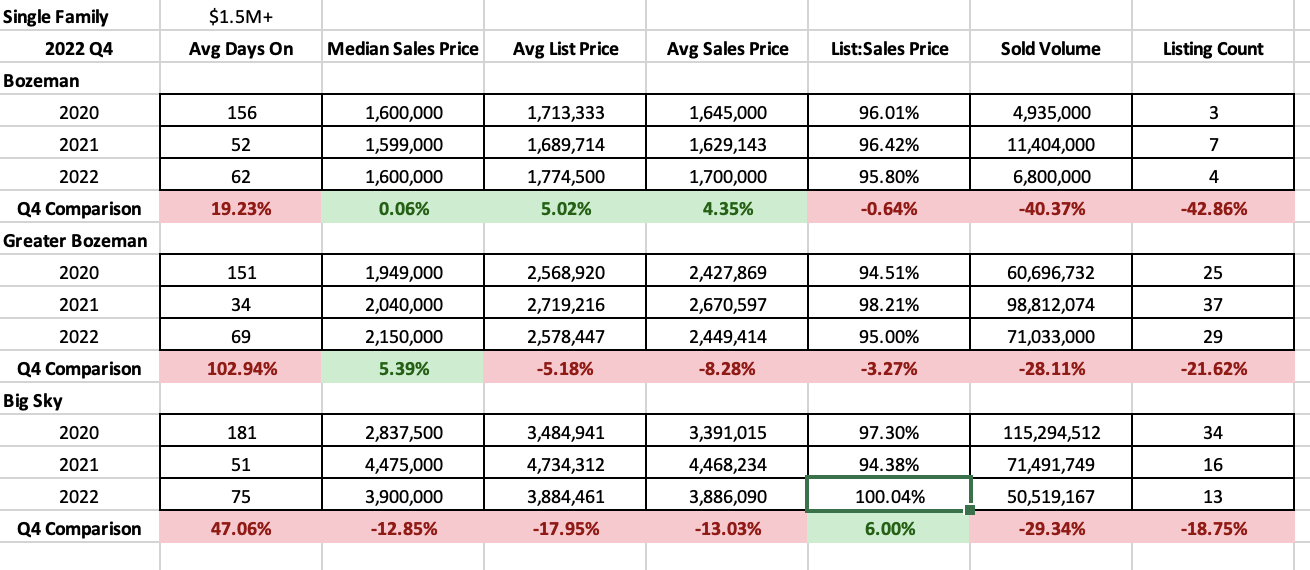
Luxury level single family home sales ($1.5M+) remained fairly robust for all areas – median sales price was fairly static for City of Bozeman but up slightly for Greater Bozeman and down slightly for Big Sky. List to sales price ratios show increased discounting in all areas but Big Sky which is likely due to longer new construction sales finally closing in Big Sky. Average discounting was about 5% for City of Bozeman and Greater Bozeman. Days on market were up for all areas with between 2-3 months average marketing time. Number of listings sold was down in all areas, with a slight change in Big Sky and more striking drops in City of Bozeman down 43% (4) and Greater Bozeman down 22% (29).
Condos and Townhomes
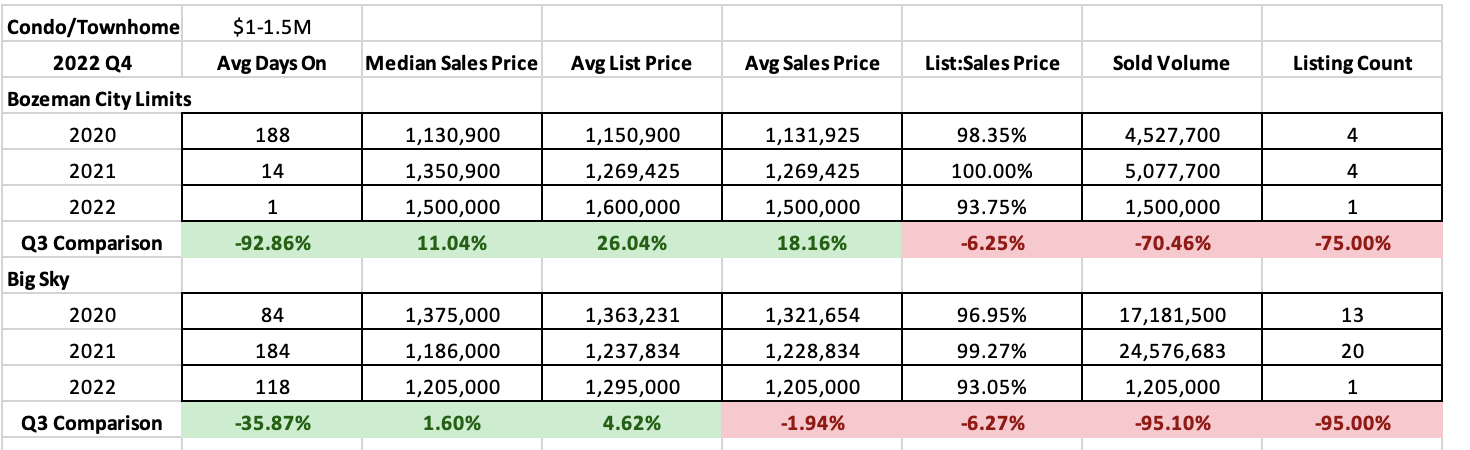
High end ($1M-$1.5M) condo and townhome transactions only had one sale in City of Bozeman in Q4 2022 and only one sale was posted in Big Sky. There are currently as of mid January 2023 15 active listings in this price point in Big Sky with one pending and 3 active listings in City of Bozeman with 6 pending. This segment of the market may be more influenced by interest rates and may also be lured by more negotiation power on single family offerings.
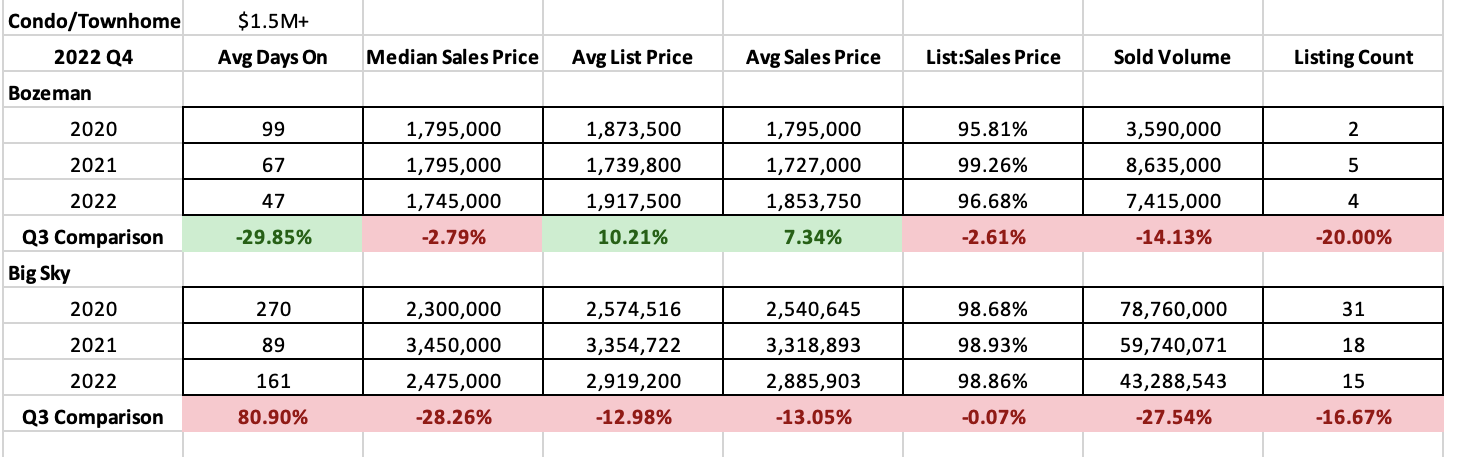
Luxury ($1.5M+) condos and townhomes were about flat in City of Bozeman for median sales price and dropped 29% in Big Sky. List to sales price ratios show increased discounting with about 3% on average in City of Bozeman and 2% on average in Big Sky. Average days on market are lower in City of Bozeman at about 1.5 months and higher in Big Sky significantly – up to about 6 months. Number of listings sold is about the same as Q4 2021 in both markets only off slightly in Bozeman (4) and about 17% in Big Sky (15) but still with a decent number of closing in comparison to previous years.