


Q4 2021 Real Estate Market Analysis & Statistics
(Scroll to bottom for Y/Y/Y or CLICK HERE)
Single Family
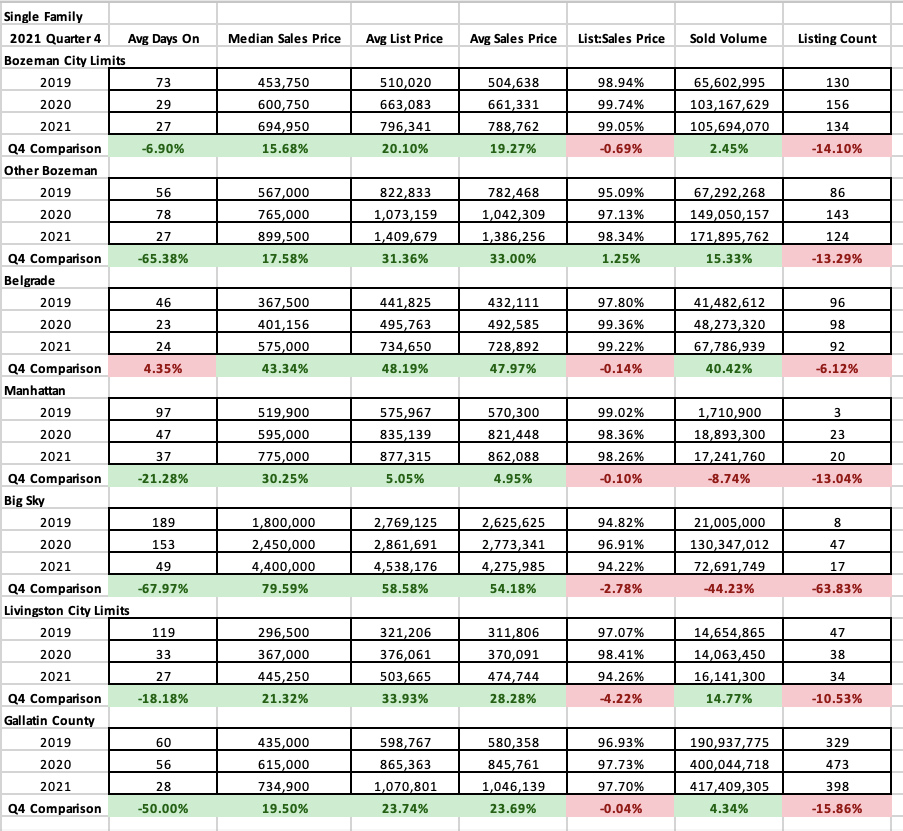
Single family home sales in Q4 2021 continued to be robust through the end of 2021, but the market was hamstrung by a lack of inventory. More listings left he market than came to market. As a result, listing sold count was reduced in all areas tracked. Some areas were more affected than others. City of Bozeman had a similar number of homes sold compared to 2019 but was down 14% over 2020. Belgrade’s numbers were stable as new construction inventory accepted demand in this area. Greater Bozeman number of units sold was higher than 2019 but reduced 14% from 2020. Manhattan was stable compared to 2020. Livingston number of units sold was down 10% from 2020 and down 27% from 2019. Big Sky was down 64% year over year but up over 2019.
As established above, number of units sold was down but not for lack of demand. This is reflected in the median sales prices that continued to blaze past 2020 levels for Q4. City of Bozeman was up 16%, Greater Bozeman was up 18%, Belgrade was up 43%, Manhattan was up 30%, Big Sky was up 80%, and Livingston was up 22%.
List to sales price ratios – which indicates how much buyers discount final sales price over list price on average – showed little to no discounting in some areas of the market and stable discounting off list price in others. City of Bozeman and Belgrade showed little discounting off list price. This is even with the increase in list prices year over year. Greater Bozeman and Manhattan saw discounting at 1.25-1.5% on average. Big Sky and Livingston saw discounting at about 6% on average.
Condo & Townhomes
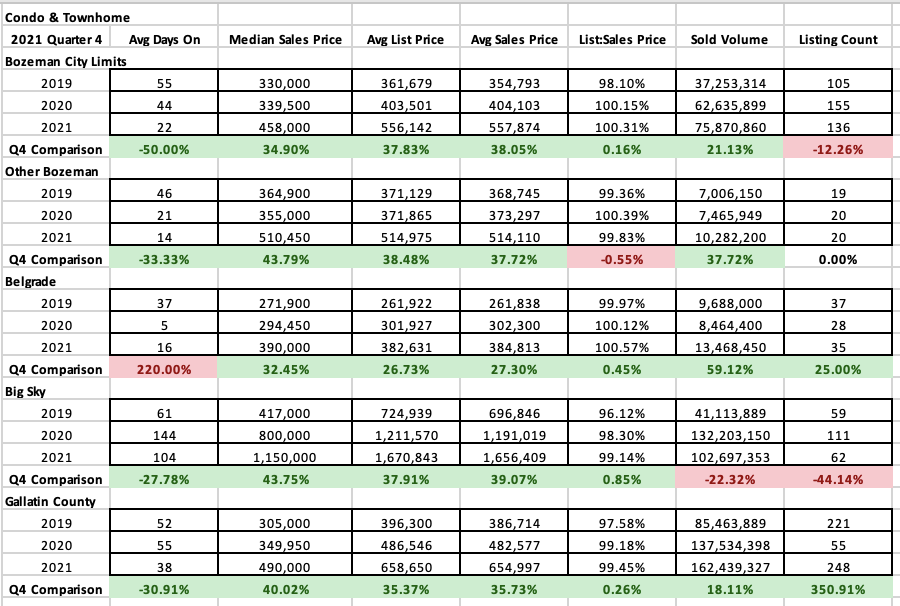
Condo and townhome sales for areas tracked (Bozeman, Belgrade, Greater Bozeman, and Big Sky) followed a similar trend in inventory – with a similar number of sales for greater Bozeman and Belgrade year over year – helped by the addition of newly built inventory. There was a downturn in number of units sold in Bozeman (down 12%) and Big Sky (down 44%) as new construction dis not fill the gap for unit demand.
Median sales price jumped again over the previous year for Q4 – with a 34% increase in City of Bozeman, 44% increase in greater Bozeman, 33% increase in Belgrade and 44% increase in Big Sky.
List to sales price ratios indicated little or no discounting by buyers in all areas with higher than list price closed prices the norm in Belgrade and Bozeman – spurred by multiple offers on well-priced properties.
Land
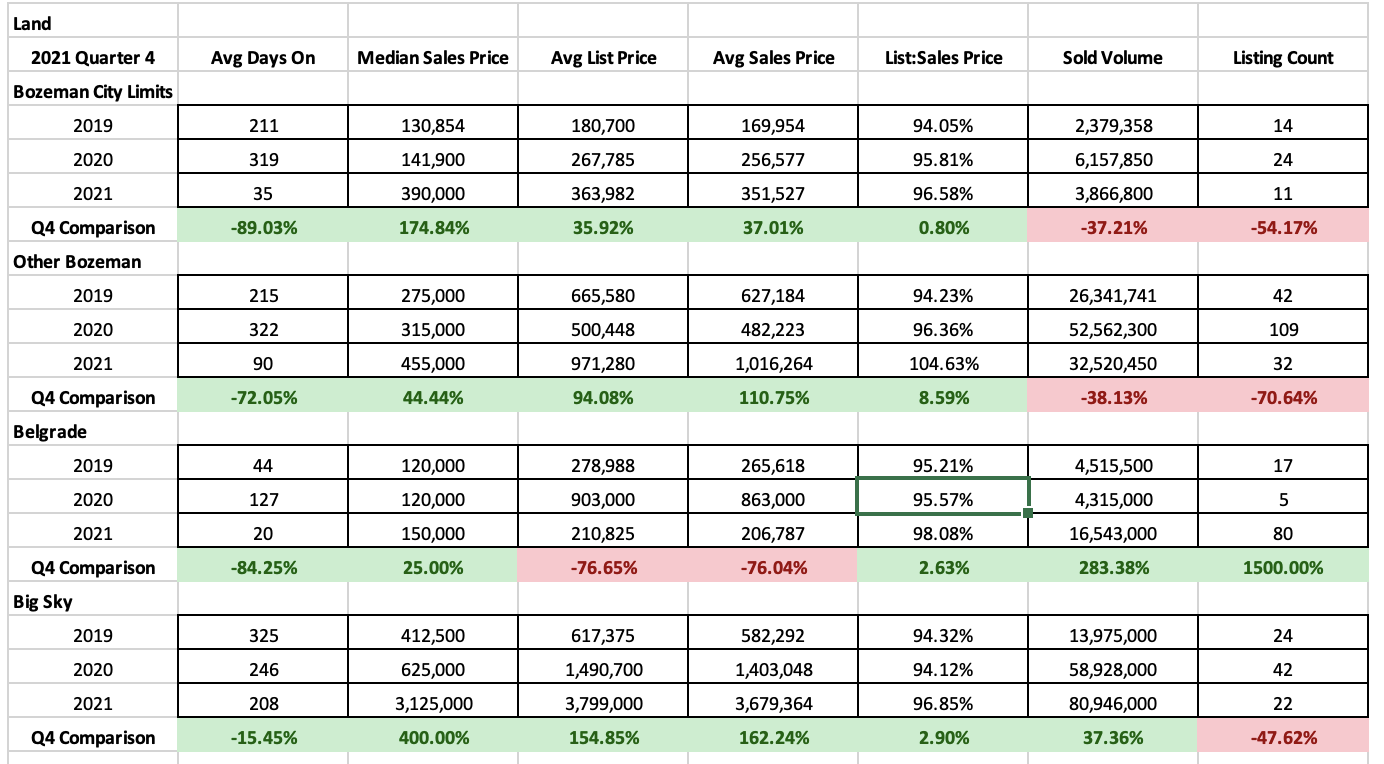
Land sales have continued to be strong in Q4 2021 but they also continue to be limited by lack of available inventory. Number of listings sold was down in City of Bozeman, Greater Bozeman and Big Sky as new subdivisions have not been introduced to meet demand. Belgrade had a new subdivision that sold off MLS but was published at the end of the year that added a significant number of lots to the final numbers.
Luxury
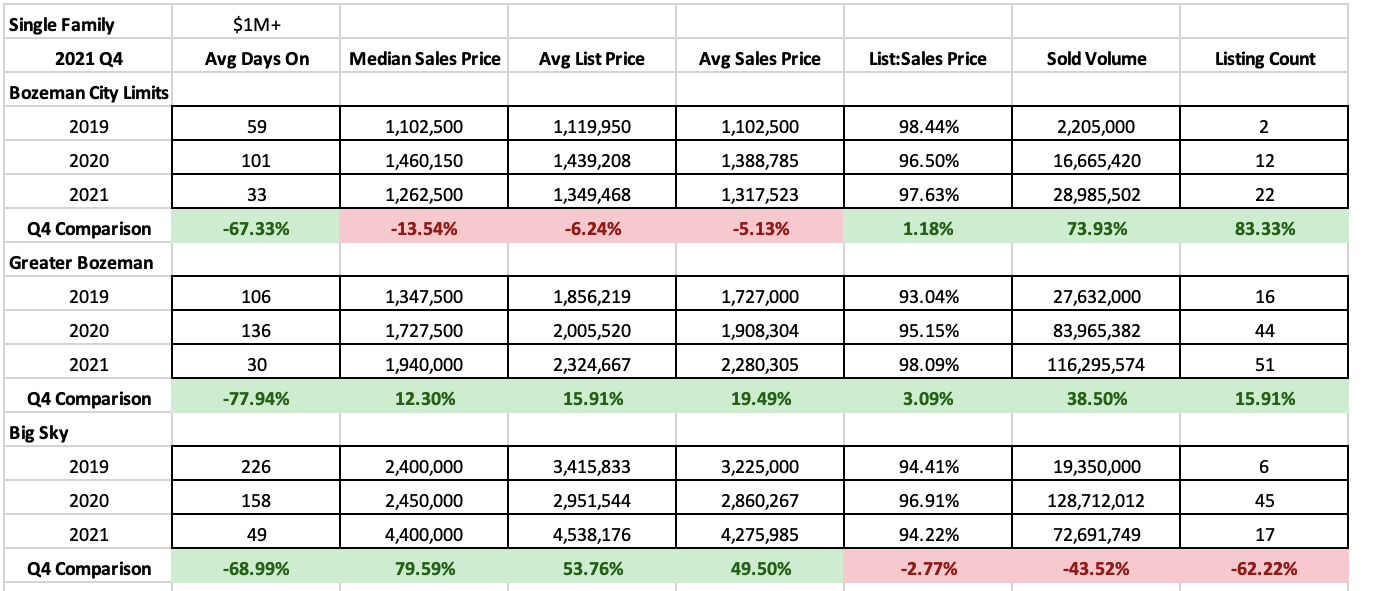
Single family luxury homes ($1M+ sales price) saw a continued uptick in the overall market, with record number of properties sold in the Bozeman (up 83%) and Greater Bozeman area (up 15%) year over year – but there was a limit due to lack of inventory in the Big Sky market (down 63%). Days on market dropped significantly – down to a month in the Bozeman and greater Bozeman markets and just over a month in Big Sky – note: these days on market are incredible for luxury properties. List to sales price ratios show limited discounting in all markets – indicating a strong seller’s market throughout the area.
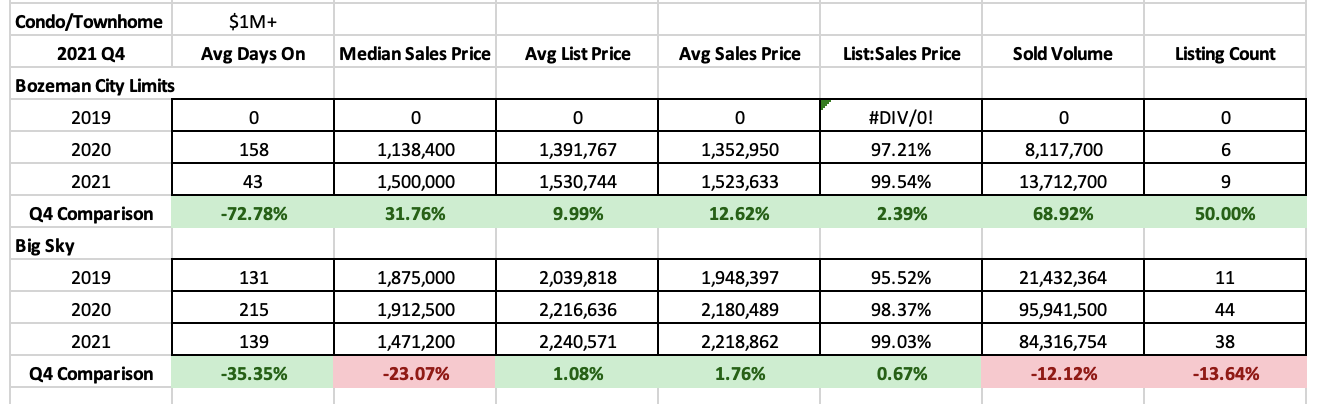
Luxury condos and townhomes ($1M+ sales price) boomed in the Bozeman area over the past two years – with new construction leading the way on available properties. Number of units sold in Bozeman was up in Q4 50% year over year, while in Big Sky units sold were down as inventory continues to be an issue. List to sales price ratios show essentially no discounting by buyers – indicative of a red-hot seller’s market. Days on market were down significantly in Q4 in both areas, though higher than what might be excepted due to the new construction nature of many sales.
Y/Y/Y 2021 Real Estate Market Analysis & Statistics
Single Family
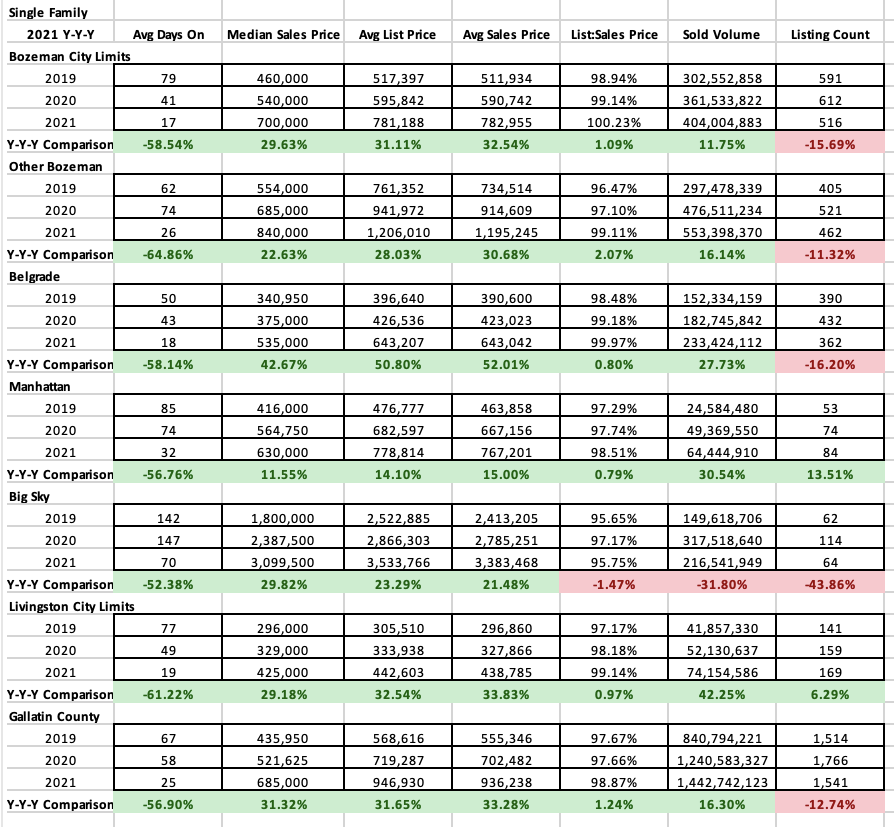
Inventory of single family homes continued to be an issue in many areas of our market overall in 2021. Year over year comparison illustrates the tight market conditions – mostly double-digit reductions in number of sold single family home properties over 2020 – but a few areas which have increased inventory sales due to new construction offerings and faster rate of sales than prior to 2020. Overall, however, many of these areas are in line or similar to inventory sold counts for 2019 but 2021 had more buyer demand than ever before.
Average days on market were at a three year low across all areas tracked – as buyer pressure and competition keep well priced properties flowing off market. Typically, there is some inventory depth to our real estate market – but the market has been without this buffer for some time and for most of 2021.
Median sales price was up to historic levels in all areas tracked in 2021 over 2020. City of Bozeman median was $700,000 and up 29% over 2020 and 52% since 2019. Greater Bozeman median was $840,000 – up 22% over 2020 and 51% over 2019. Belgrade median was $535,000 and was up an amazing 43% since 2020 and 57% over 2019 mostly due to new construction homes brought to market in the past two years. Manhattan median was $630,000 and is up 11% over 2020 and 51% over 2019. Big Sky rose 30% over 2020 to a median sales price over $3M – a jump of 72% over 2019. Livingston city limits saw a median price climb to $425,000 – a jump of 29% over 2020 – and 43% over 2019.
List to sales price ratios – indicating how much buyers are discounting off list price on average – tell the same tale. Above ask closings in 2021 were the norm in the City of Bozeman. Very little discounting was happening in greater Bozeman, Belgrade and Livingston – less than 1% on average – indicating a very strong seller’s market. In Big Sky, list to sales price discounting has remained with historic averages, even with the incredible increases in median sales price.
Condos & Townhomes
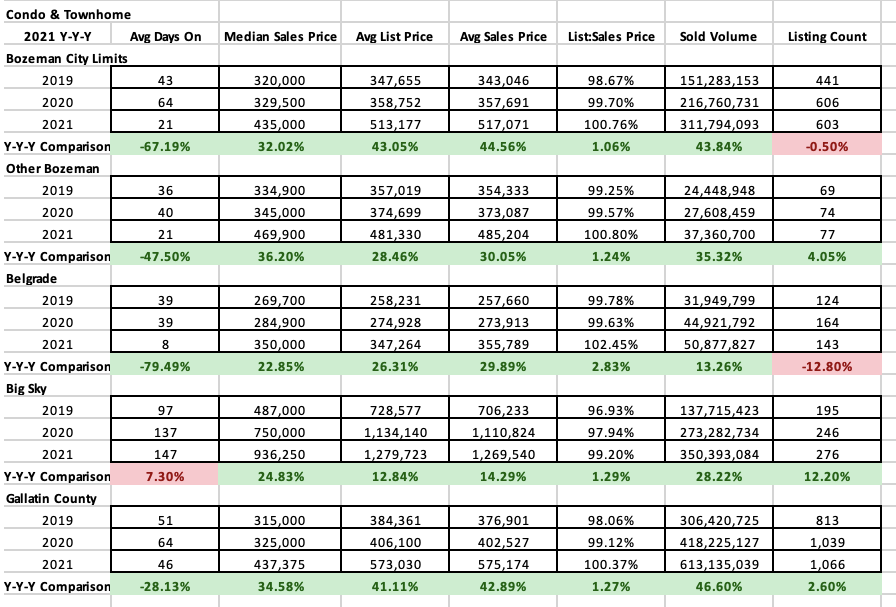
Condos and townhome sales in areas tracked (Bozeman, Greater Bozeman, Belgrade, Big Sky) had another big year in 2021. Number of listings sold were more steady in this sector of the market with new construction offerings helping to fill demand. There remained more demand than properties even though there were big gains in median sales price and a narrowing of list to sales price ratios in all areas. Days on market were at historic lows in 2021 in most areas – with the exception of Big Sky where new construction offerings pushed days on market up.
Buyers pushed pricing while competing for properties – median sales price jumped 32% in Bozeman to $435,000, 36% in greater Bozeman to $469,900, 23% in Belgrade to $350,000 and 25% in Big Sky to $936,250. List to sales price ratios show that buyers on average were paying more than list price in City of Bozeman, Greater Bozeman and Belgrade and only discounting very slightly in Big Sky.
Land
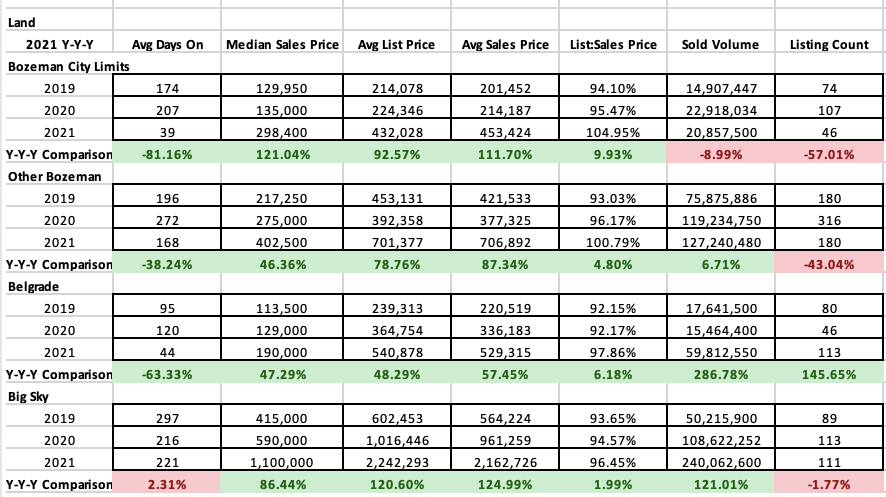
Land sales continued to be hamstrung in most areas tracked in our market in 2021 by lack of inventory. Number of sales was down 58% in City of Bozeman, 43% in Greater Bozeman. Sales are up in Belgrade due to a new subdivision that was sold in 2021 in city limits. And Big Sky was stable year over year for sales. Days on market reduced to at or near historic lows in all areas.
Median sales prices soared for land in 2021 – City of Bozeman saw a 121% median sales price increase in 2021 over 2020 to $298,400. Greater Bozeman saw a 46% increase over 2020 to $402,500. Belgrade saw a 48% increase over 2020 to $190,000. Big Sky rose 86% over 2020 to $1.1M.
List to sales price ratios tightened to historic levels in 2021 – on average buyers were paying more than list price in City of Bozeman and Greater Bozeman and discounting 2% in Belgrade and 3% in Big Sky – both indicative of strong seller markets with the large jump in median sales price.
Luxury
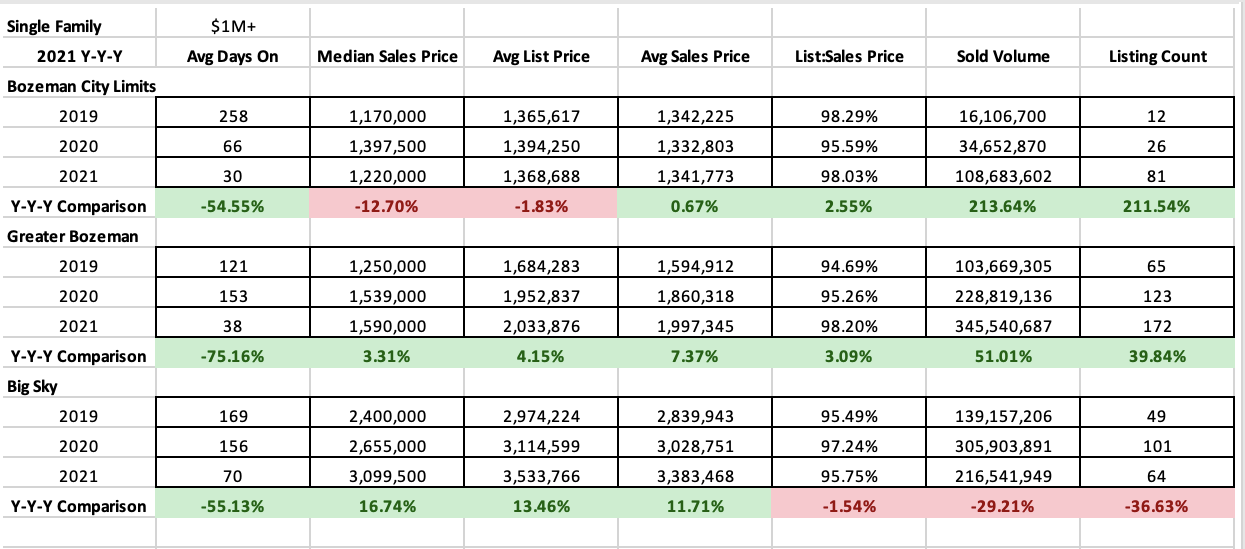
Single family luxury homes ($1M+ sales price) in 2021 saw a dramatic increase in number of units sold in City of Bozeman (up 211%) and greater Bozeman (up 40%). Big Sky saw a decline of 36% as inventory constraints hampered the market. Days on market shortened to historic lows – down to 30 days in City Bozeman on average, 38 days in greater Bozeman and 70 days in Big Sky. List to sales price ratios indicate very little discounting by buyers in this price point – tightening ratios in City of Bozeman and Greater Bozeman indicate strong market competition. Big Sky remained at or near historic levels for discounting, even with historic median sales price increases.
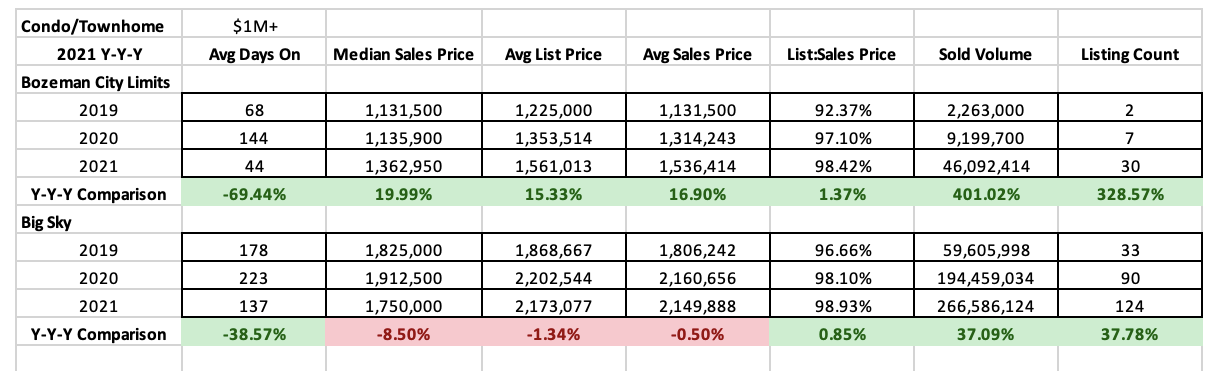
Luxury condos and townhomes ($1M+ sales price) in 2021 saw historic volume as new construction in this segment helped to alleviate some of the buyer pressure. Number of listings sold were up 330% in City of Bozeman – again fueled by new construction offerings – and up 38% in Big Sky. Average days are market are at historic lows for luxury condos and townhomes. And list to sales price ratios tightened in both Bozeman and Big Sky – indicative of a continued competitive seller’s market even in the luxury sector.