For a graphical chart version of this information, please visit our Market Stats page.
Q4 2019 Y/Y/Y Analysis
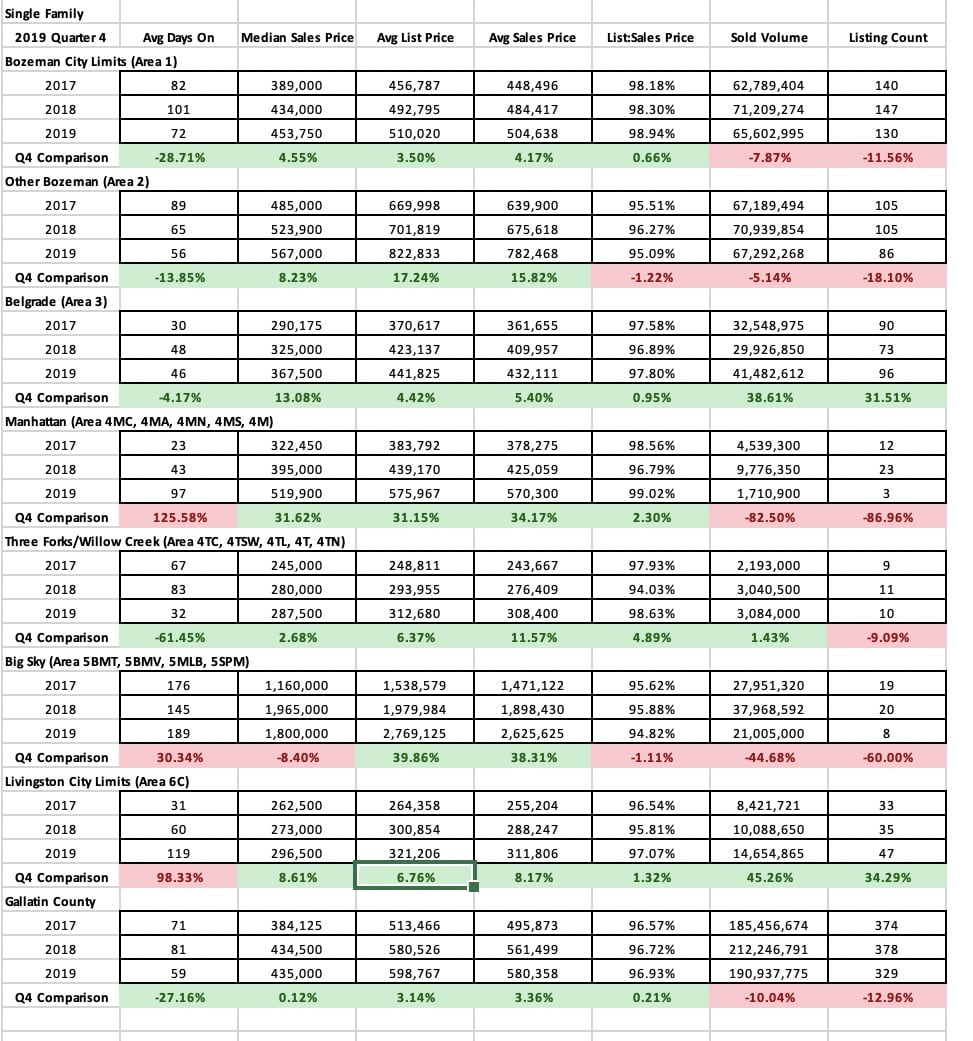
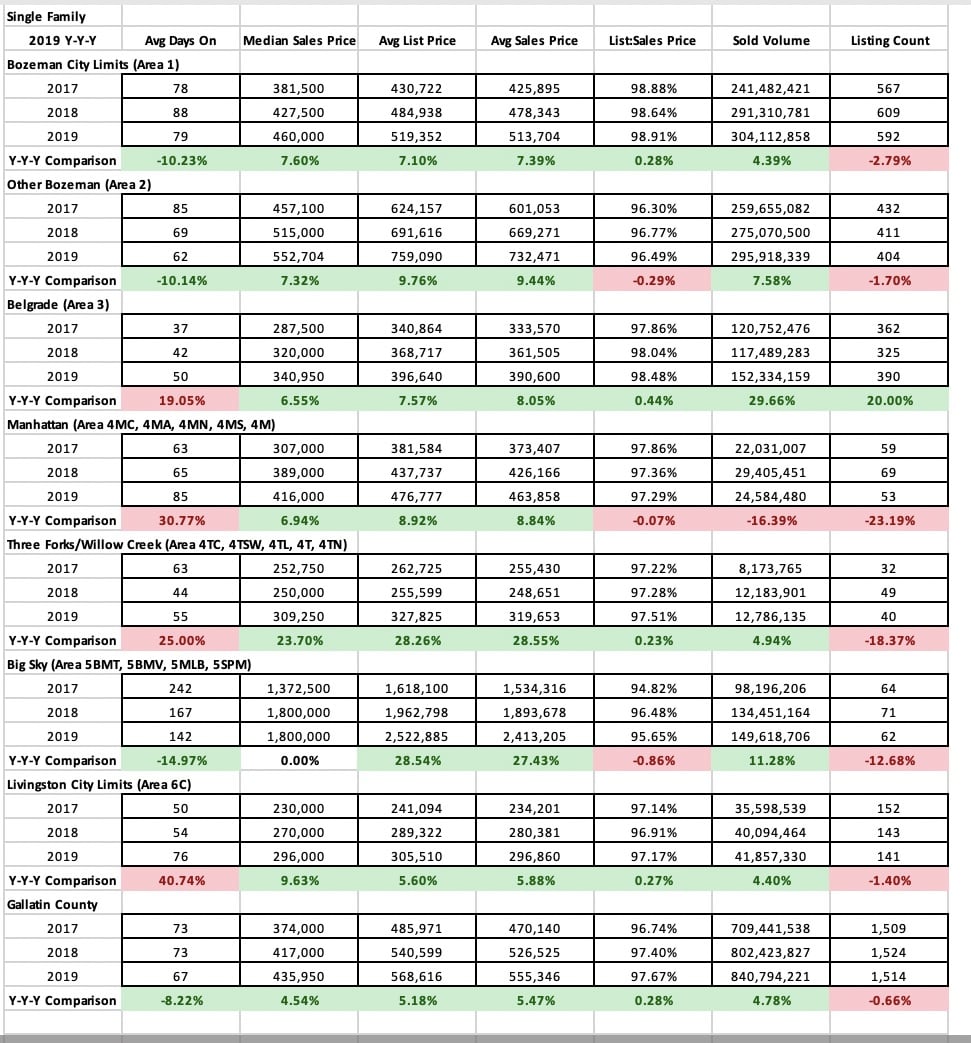
The market in Quarter 4 2019 continued the theme of growth in most sectors and areas of the market. Single family home sales saw median sales price jumps of 4% in City of Bozeman and 13% in City of Belgrade Y/Y – with 8% in greater Bozeman and Livingston City Limits. Big Sky saw a slight decline in median sales price as half as many homes sold in Q4 – as inventory tightens. Days on market are up in Big Sky, Livingston, and Manhattan – and down in Bozeman, Belgrade and greater Bozeman areas. Average list to sale price ratios show minimal discounting in Bozeman, greater Bozeman, Manhattan and Belgrade – slightly more in Livingston and Big Sky – but all indicative of a continued seller’s market. Number of units sold has trended downward in most areas of the market, with Belgrade as the only area showing a positive jump of 31% as new construction continues to boom there.
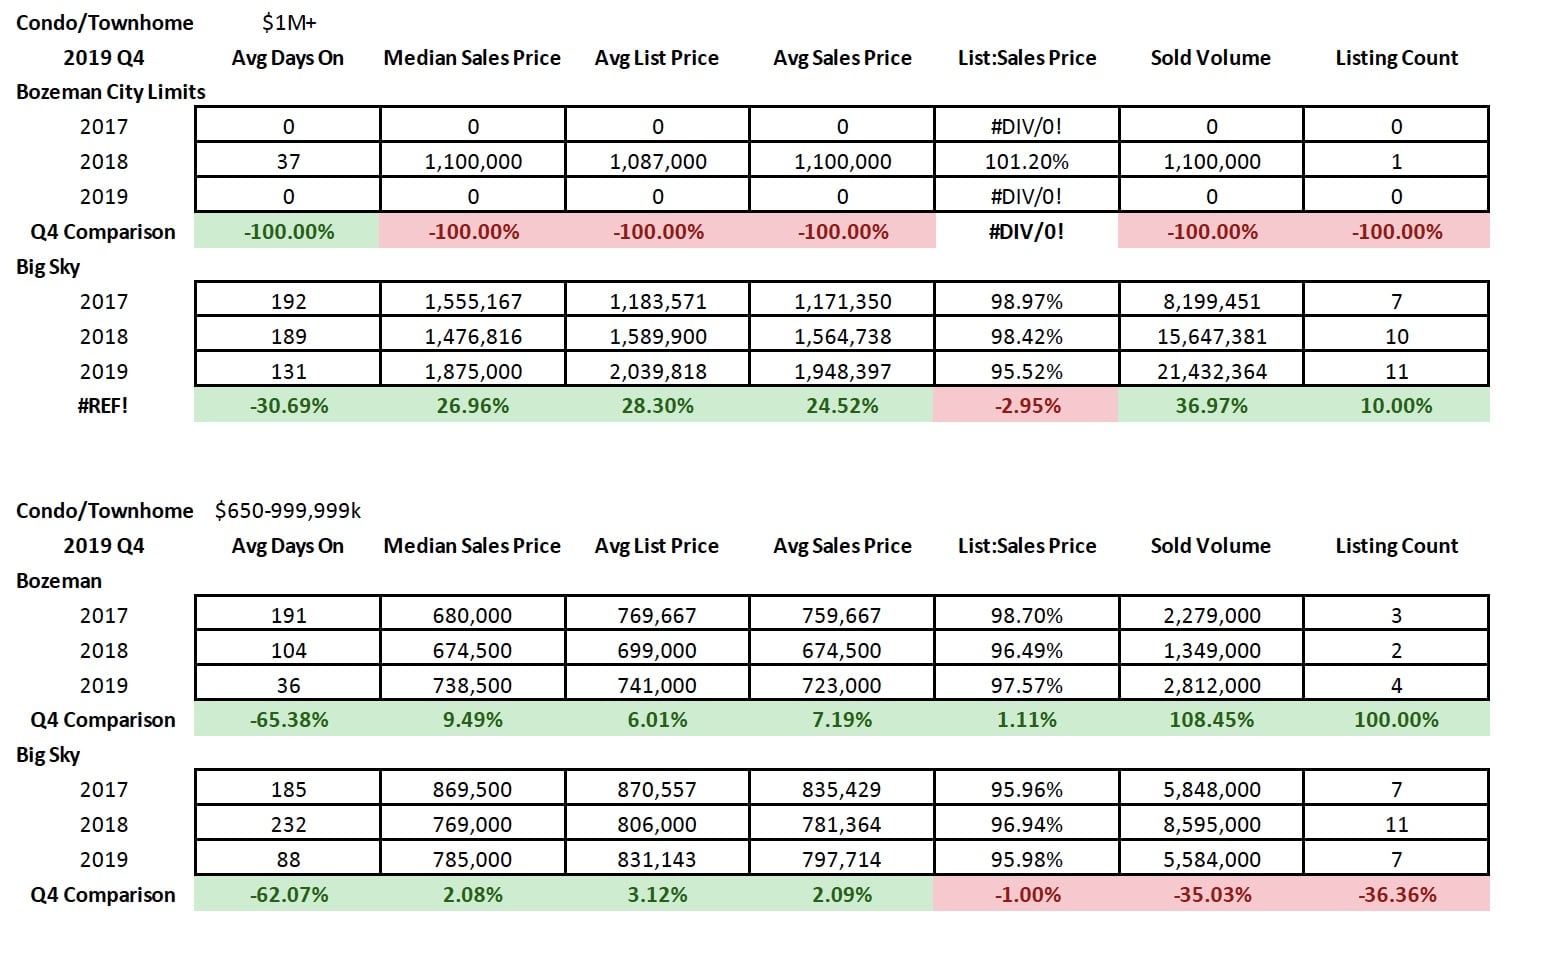
Condo and townhome sales had a bigger jump in median sales price in most areas, with 13% City of Bozeman, 17% greater Bozeman, 12% Belgrade. Big Sky fell 22% as more entry level product has sold. Number of units sold is trending upward in all areas with the exception of City of Bozeman which has stayed relatively flat. Averages list to sales price ratio shows a strong seller’s market in Bozeman, greater Bozeman and Belgrade with a slightly more balanced market in Big Sky.

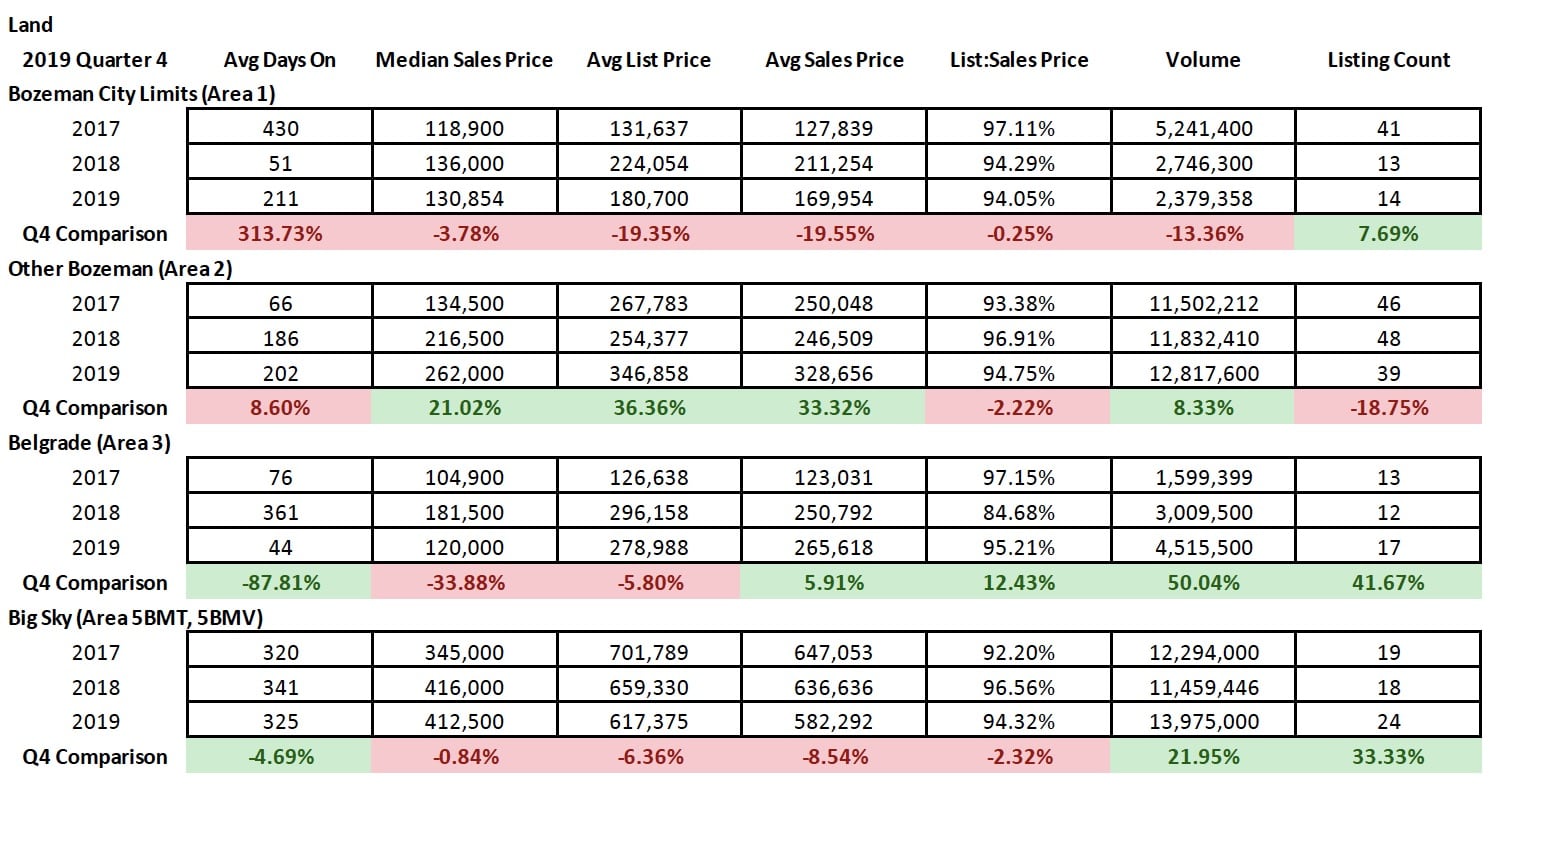
Land sales have stayed relatively flat in City of Bozeman as new product has waned. Greater Bozeman area has seen a decent jump in median sales price. Number of listings sold has jumped in Big Sky and Belgrade – likely translating partially to pipeline new product that will hit the market in 2020. Overall discounting of about 4-5% is commonplace – indicative of a more balanced market.
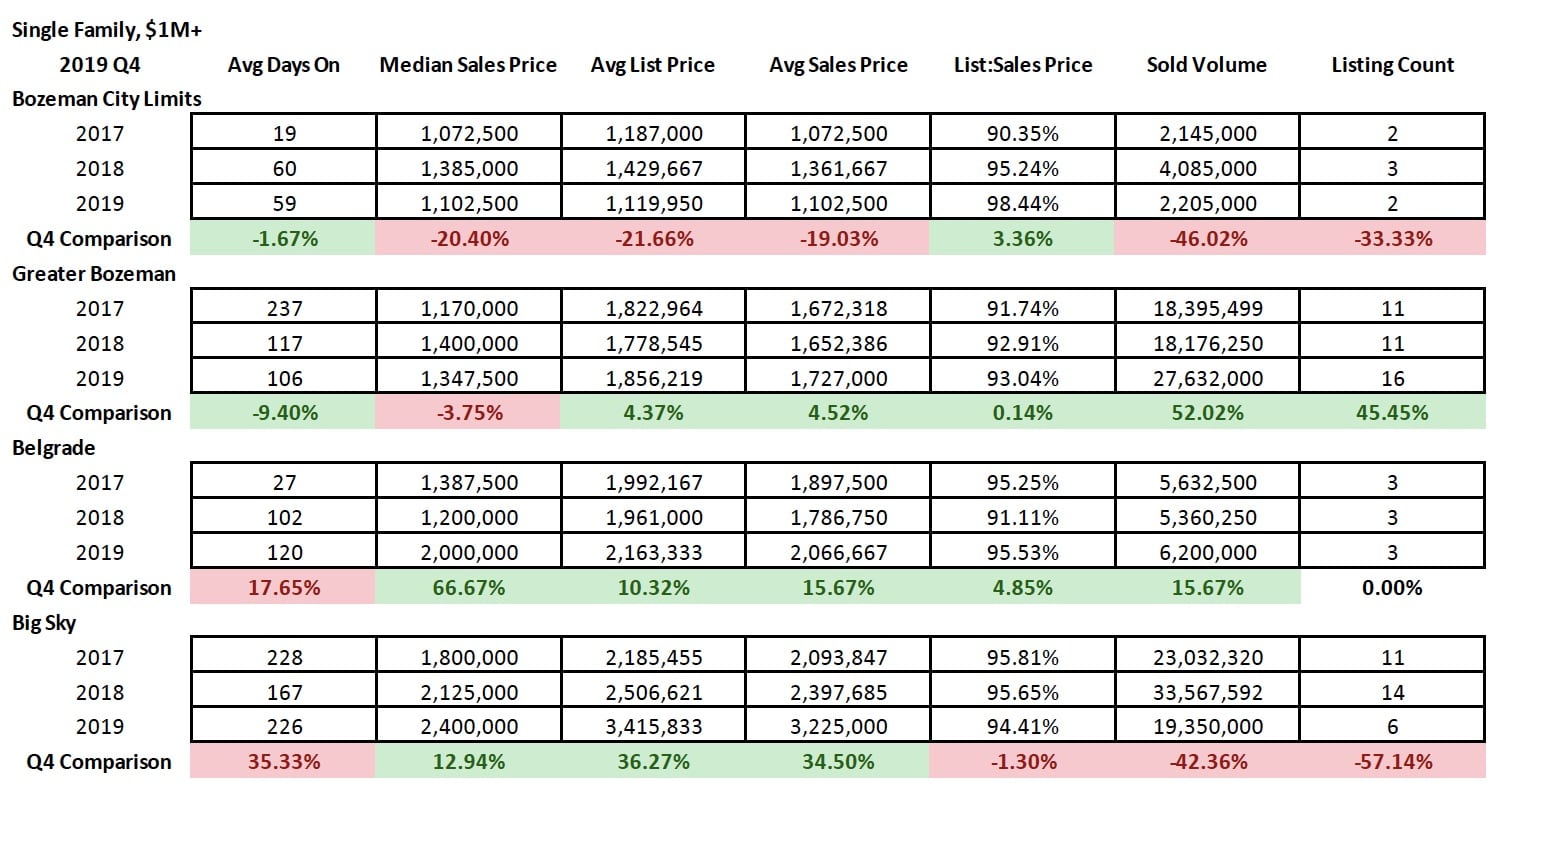
Q4 2019 Y/Y/Y High End and Luxury Analysis
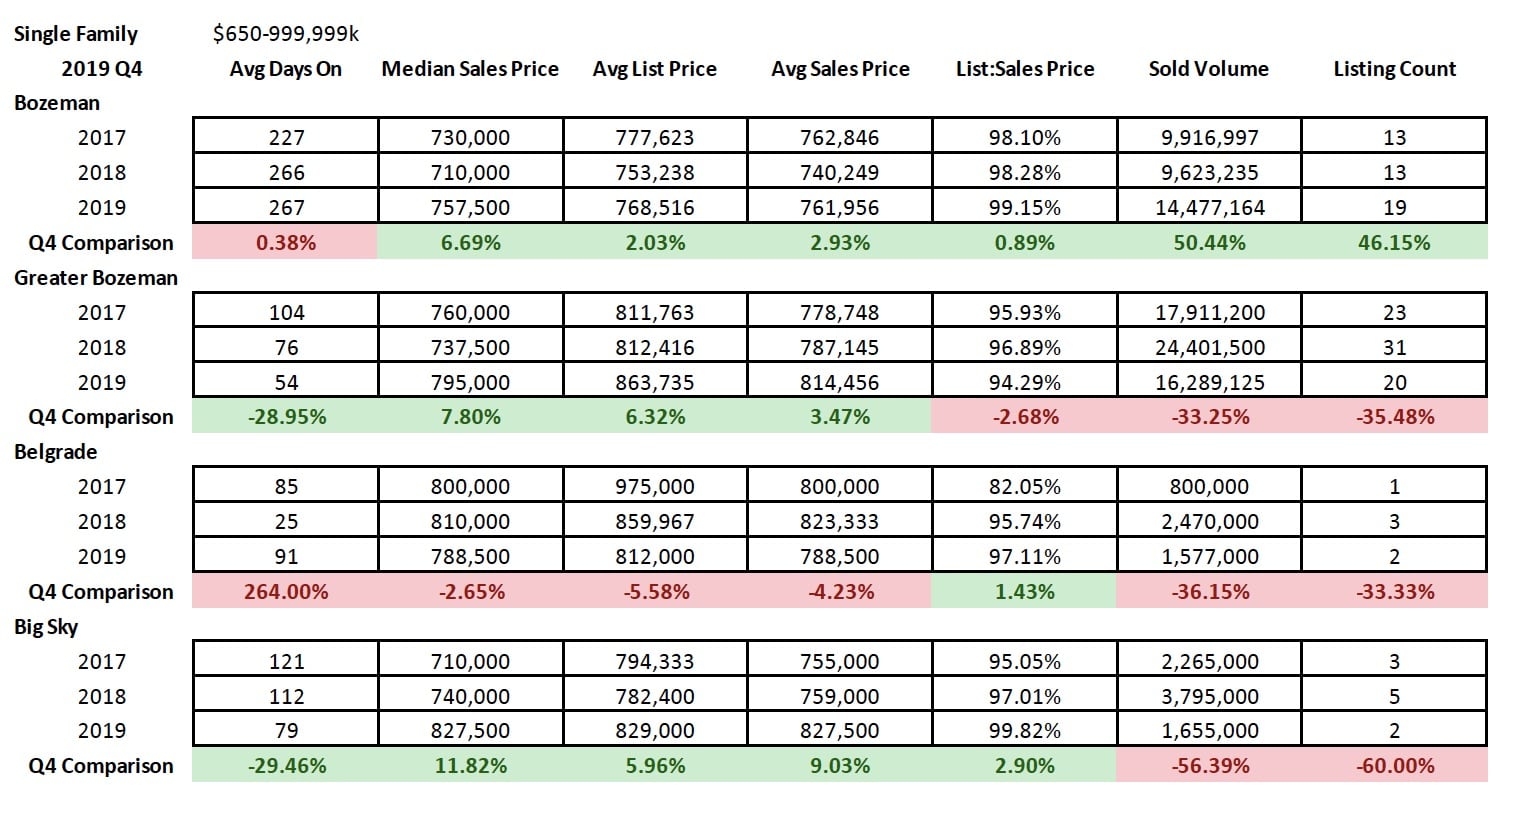
High end single family home listings ($650K-$999K) show a jump in sales in city of Bozeman – and with a strong seller’s market in this area. Other areas have stayed flat or declined in number of sales – but list to sales price ratios are indicative of a strong seller’s market from a pricing perspective in all areas.
Luxury single family home sales ($1M+) have stayed relatively flat for number of sales in Bozeman City limits and Belgrade. A slight jump in greater Bozeman in number of units sold and a decline in Big Sky. List to sales price ratios show a tighter seller’s market in City of Bozeman with a more balanced, even a buyers market trending, in greater Bozeman, Big Sky and Belgrade aras. Average days on market continue to range from a tight 60 days in City of Bozeman to 3 months in greater Bozeman, four months in Belgrade and 7 months in Big Sky
Condo and townhome sales were not quite as robust in the high end sector of the market, with Big sky dropping slightly in number of units sold and staying relatively flat for discounting – however, days on market shortened to just under 3 months on average. City of Bozeman saw a slight uptick, with less discounting and less days on market. Luxury condo and townhome sales saw a continued strong market in Big Sky as buyers search for a more maintenance free lifestyle in the mountains. Days on market have shortened to just over 4 months and discounting remains in seller’s market territory.
2019 Y/Y/Y Analysis
Single family home sales year over year show continued strength in the market in all market areas. Median sales price appreciation ranged in the 6-7% range for City of Bozeman, greater Bozeman, Belgrade, and Manhattan. Big Sky remained flat while Livingston jumped almost 10%. Days on market City of Bozeman, greater Bozeman and Livingston averages 2-2.5 months. Belgrade remains the lowest with just under 2 months average. Big Sky remains about 5.5 months. List to sales price ratios are indicative of a seller’s market in all areas, with stronger seller’s markets in City of Bozeman and Belgrade.
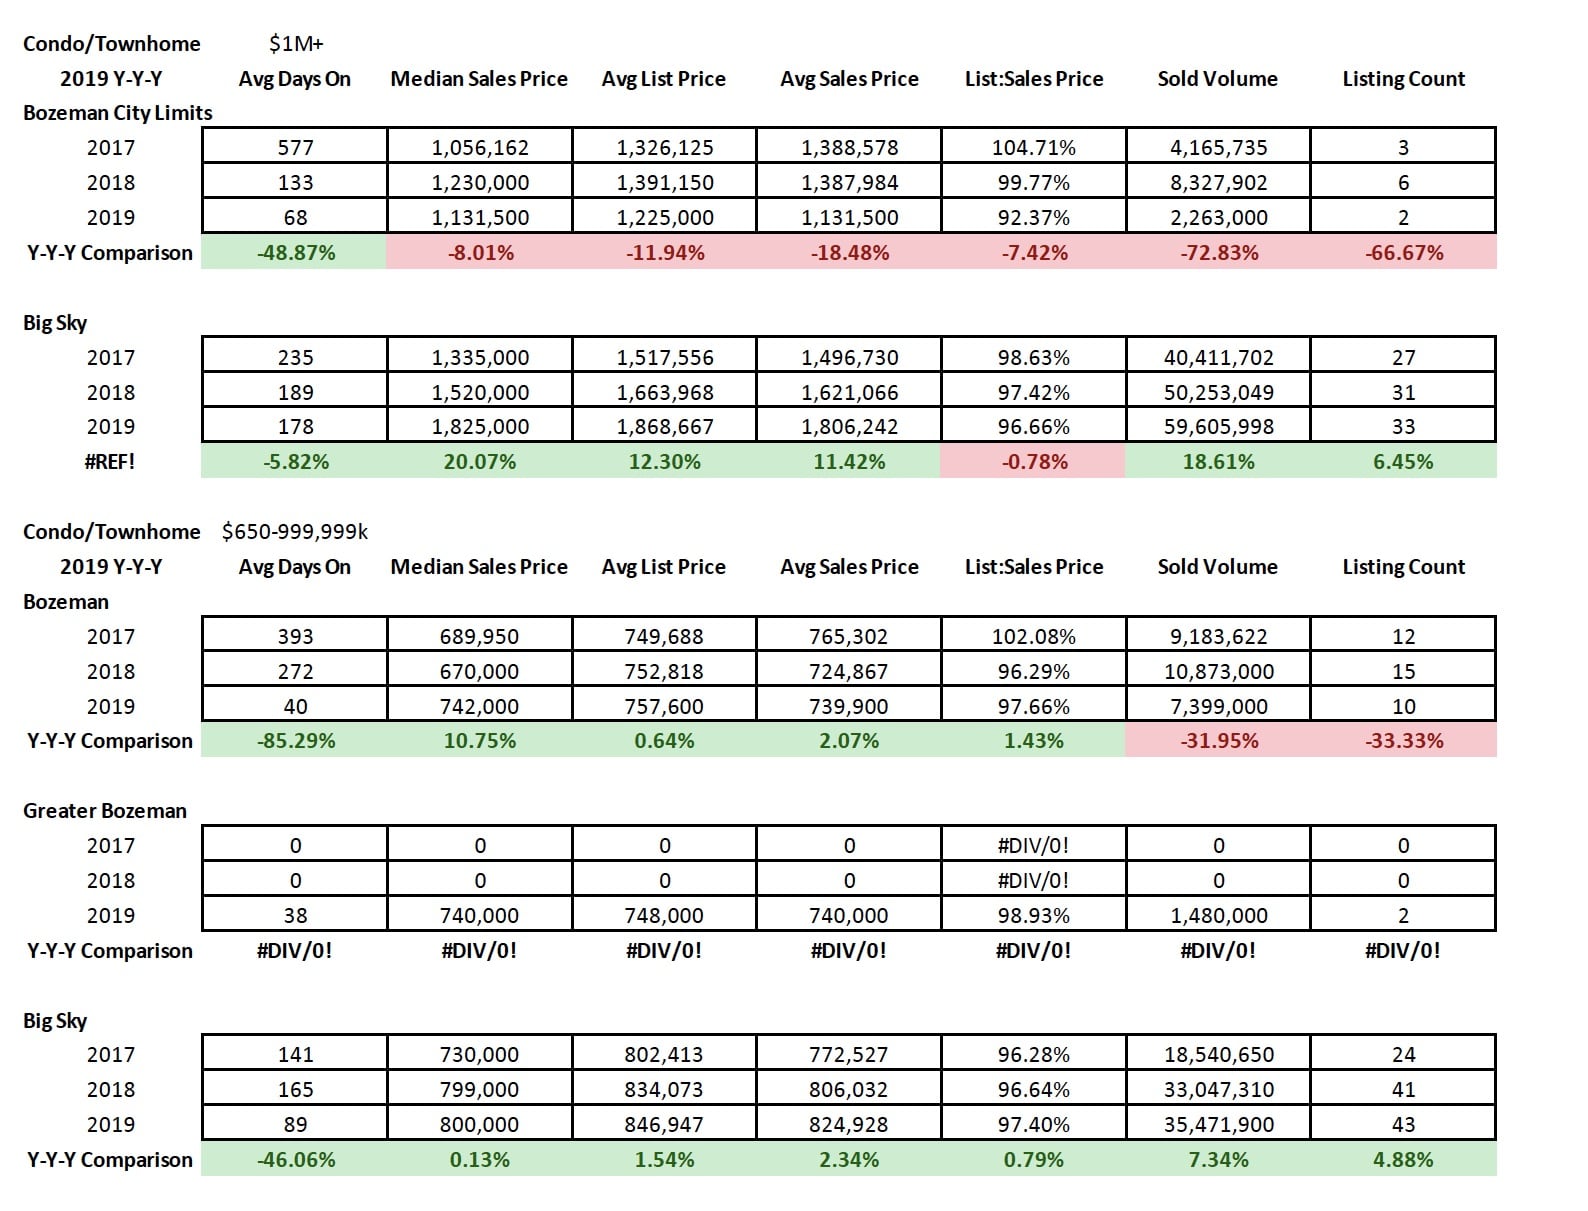
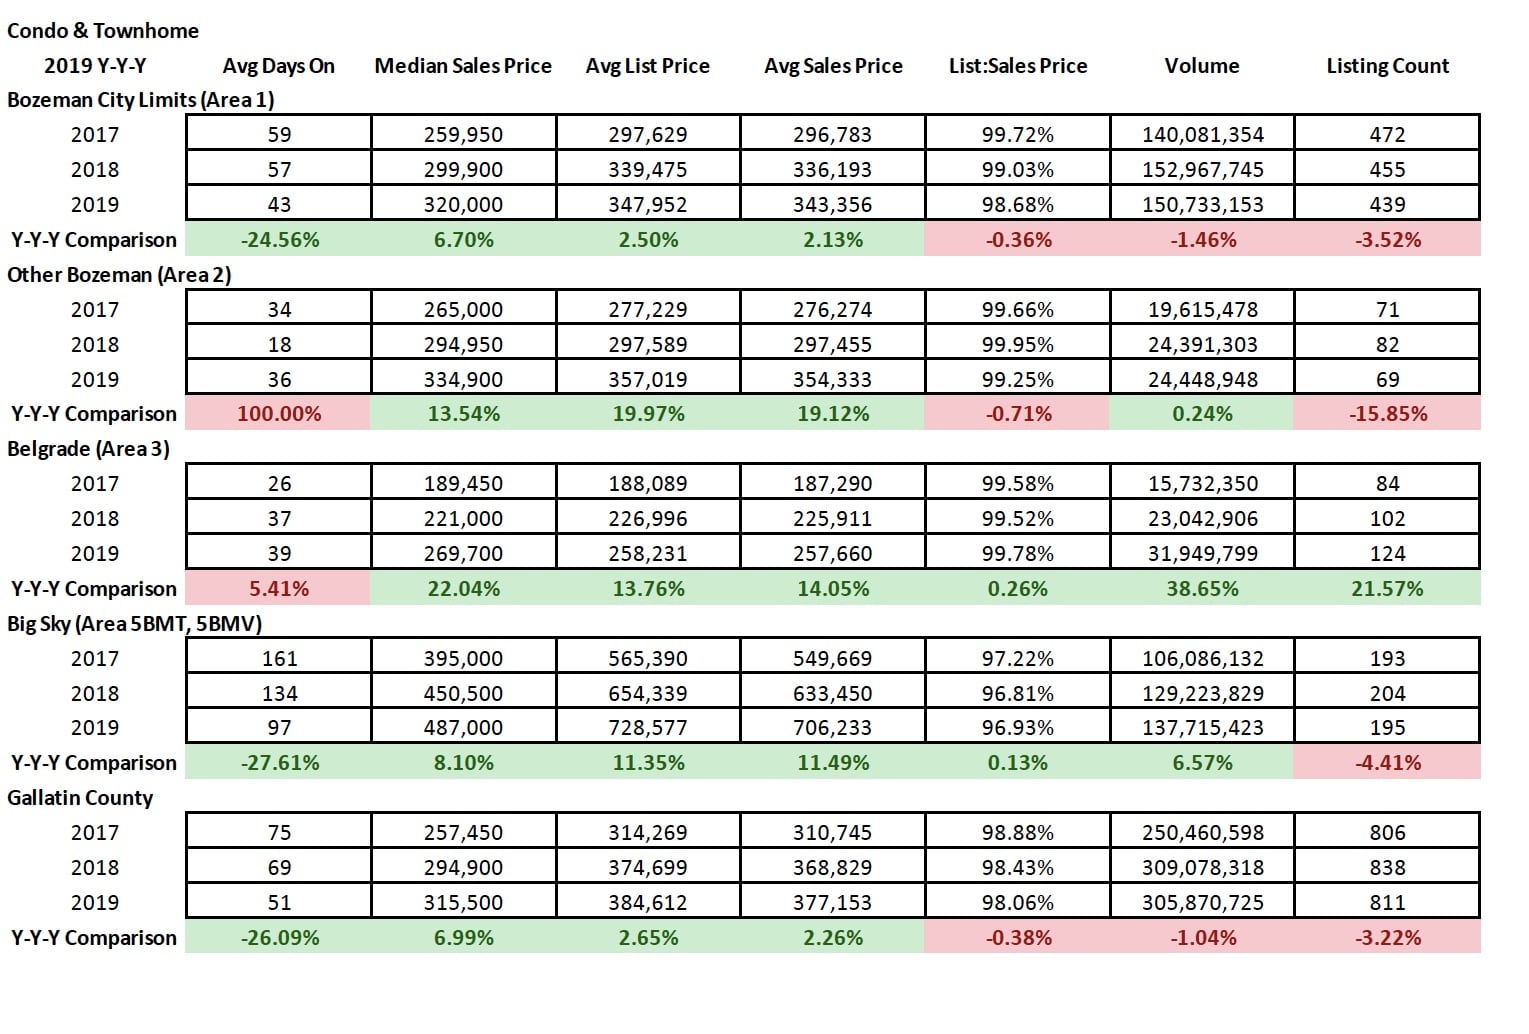
Condo and townhome sales have continued to harbor the highest median sales price appreciation, with all areas showing a sizeable uptick. City of Bozeman and Big Sky ranged 7-8%. Greater Bozeman was at 14% and Belgrade jumped 22%. Listing counts sold dropped in all areas with exception of Belgrade which is at the forefront of construction. List to sales price ratios show discounting at a minimum in City of Bozeman, Belgrade and greater Bozeman – just slightly more in Big Sky – all indicative of a strong seller’s market.
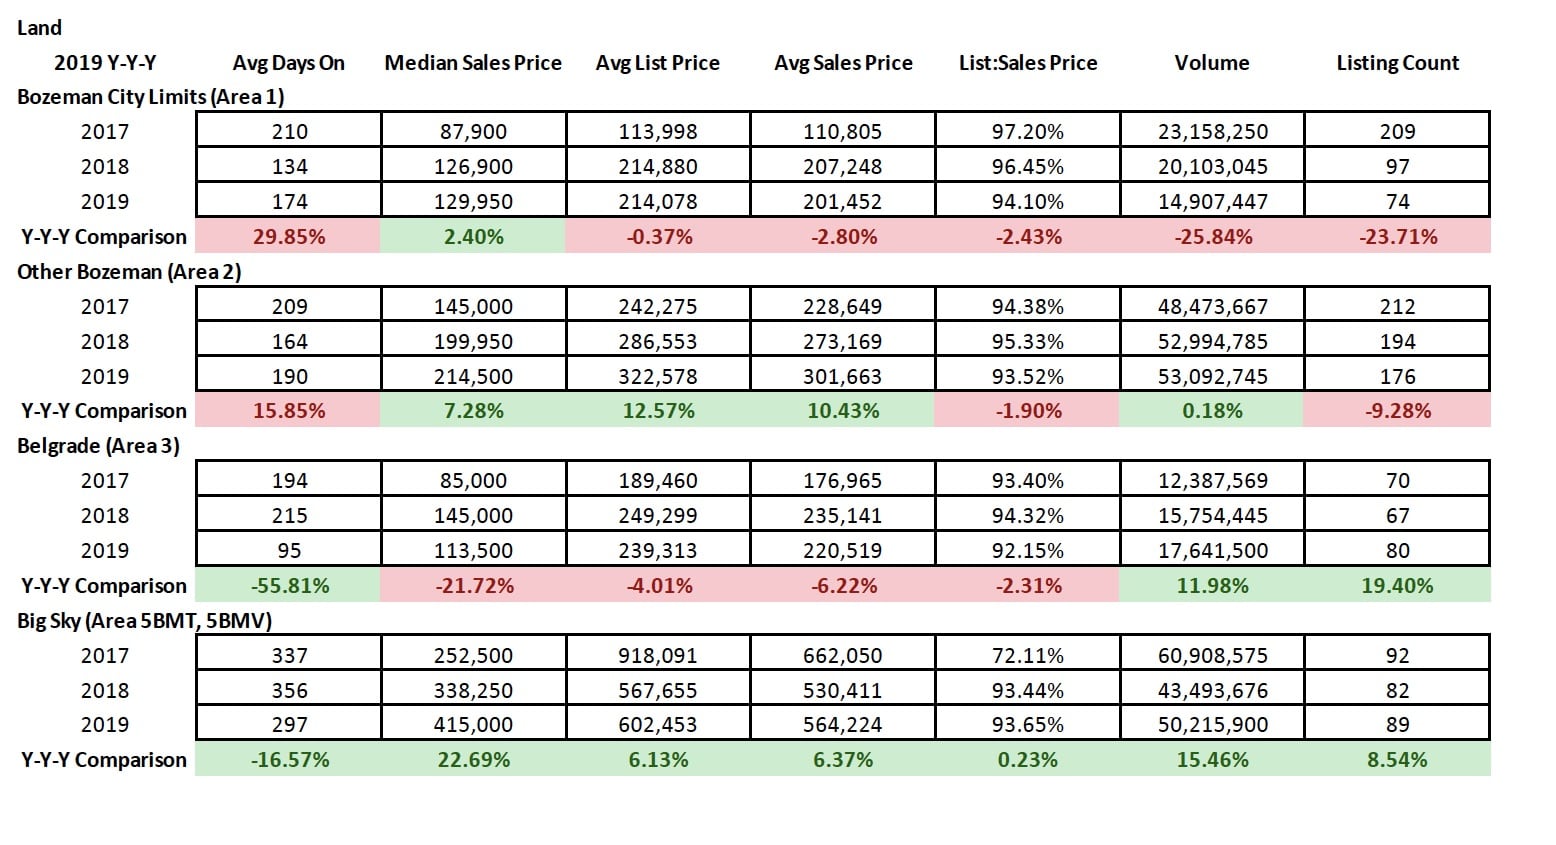
Land sales have remained relatively flat in City of Bozeman, have risen modestly in greater Bozeman but have surged in City of Belgrade and Big Sky. List to sales price ratios show discounting is happening but prices aren’t dropping off the new highs established last year.
2019 Y/Y/Y High End and Luxury Analysis
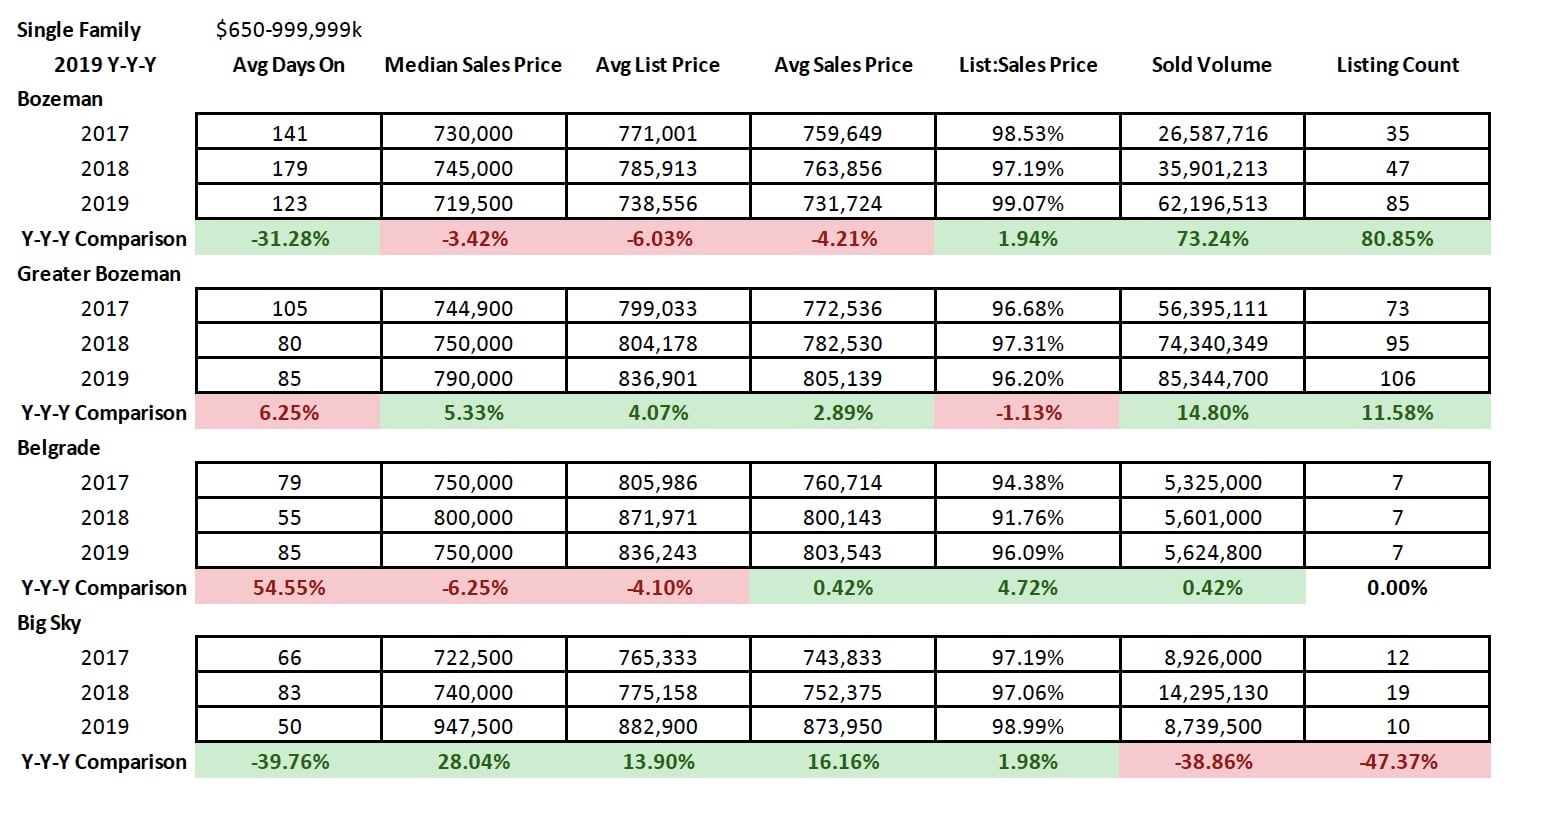
High end ($650K-$999K) single family home listings year over year have showed strong activity across all areas. List to sales price ratios show a strong seller’s market in City of Bozeman and Big Sky with little dis counting. Number of units sold has ramped up considerably in City of Bozeman and greater Bozeman areas as well. Days on market are ranging from just over 4 months in City of Bozeman to closer to 3 months in greater Bozeman and Belgrade and just under 2 months in Big Sky.
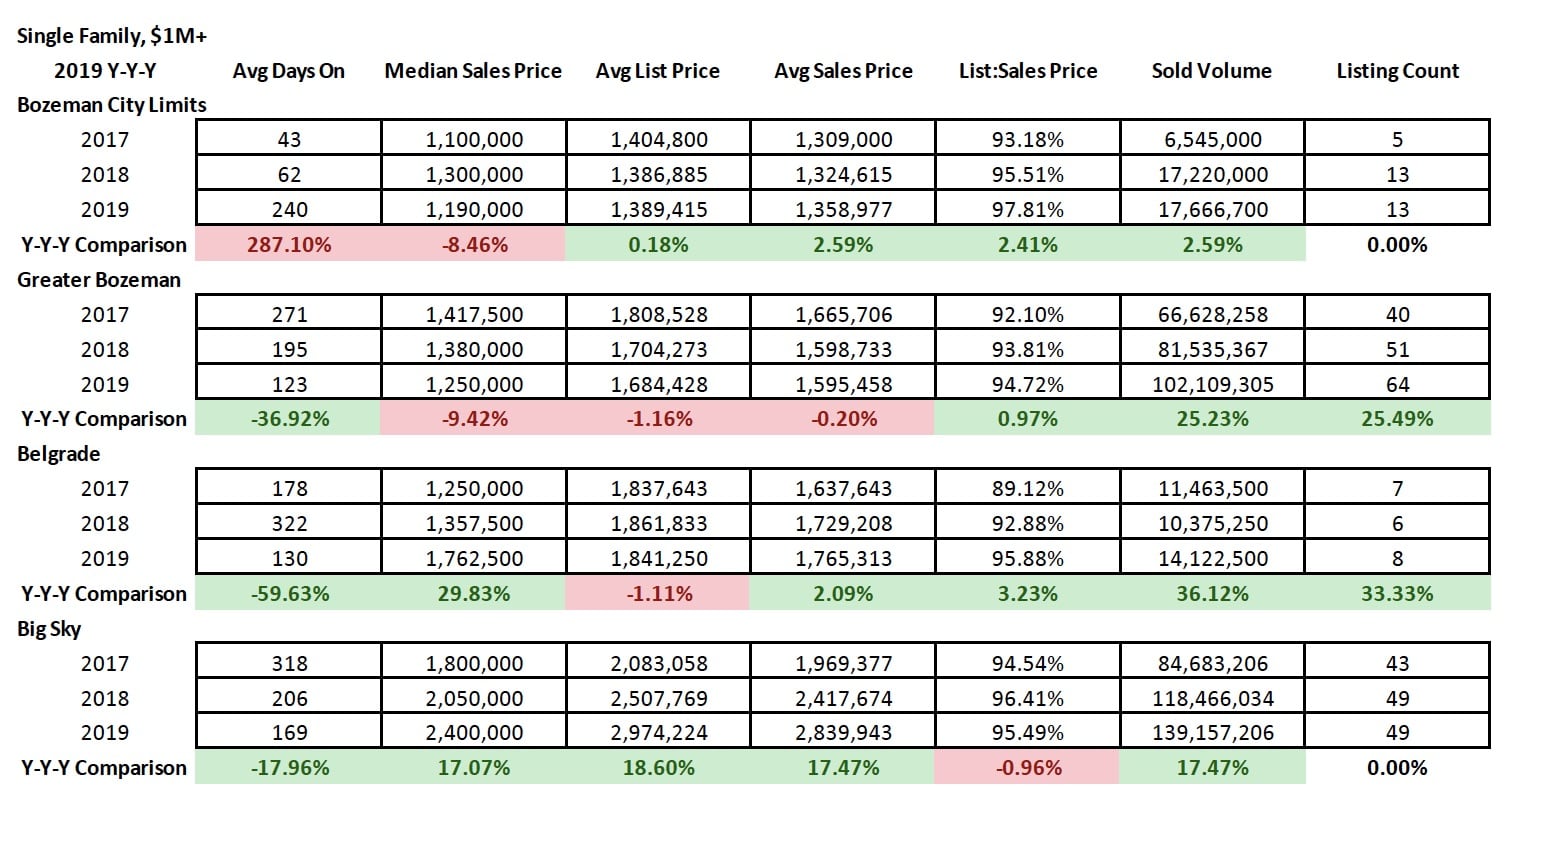
Luxury ($1M+) single family home listings year over year have stayed constant in Bozeman, Belgrade and Big Sky to pervious years and ramped up in greater Bozeman area. Days on market have reduced Y/Y in all areas except City of Bozeman, with times averaging 4 months in greater Bozeman and Belgrade to 5 months in Big Sky and 8 months in Bozeman.
High end condo and townhome sales year over year have remained constant in Big Sky and dropped slightly in Bozeman. List to sales price ratios show minimal discounting on average, indicating a seller’s market in this sector.
Luxury condo and townhome sales have stayed strong in Big Sky, with slight discounting showing a more balanced market – days on market are down to about 6 months.