


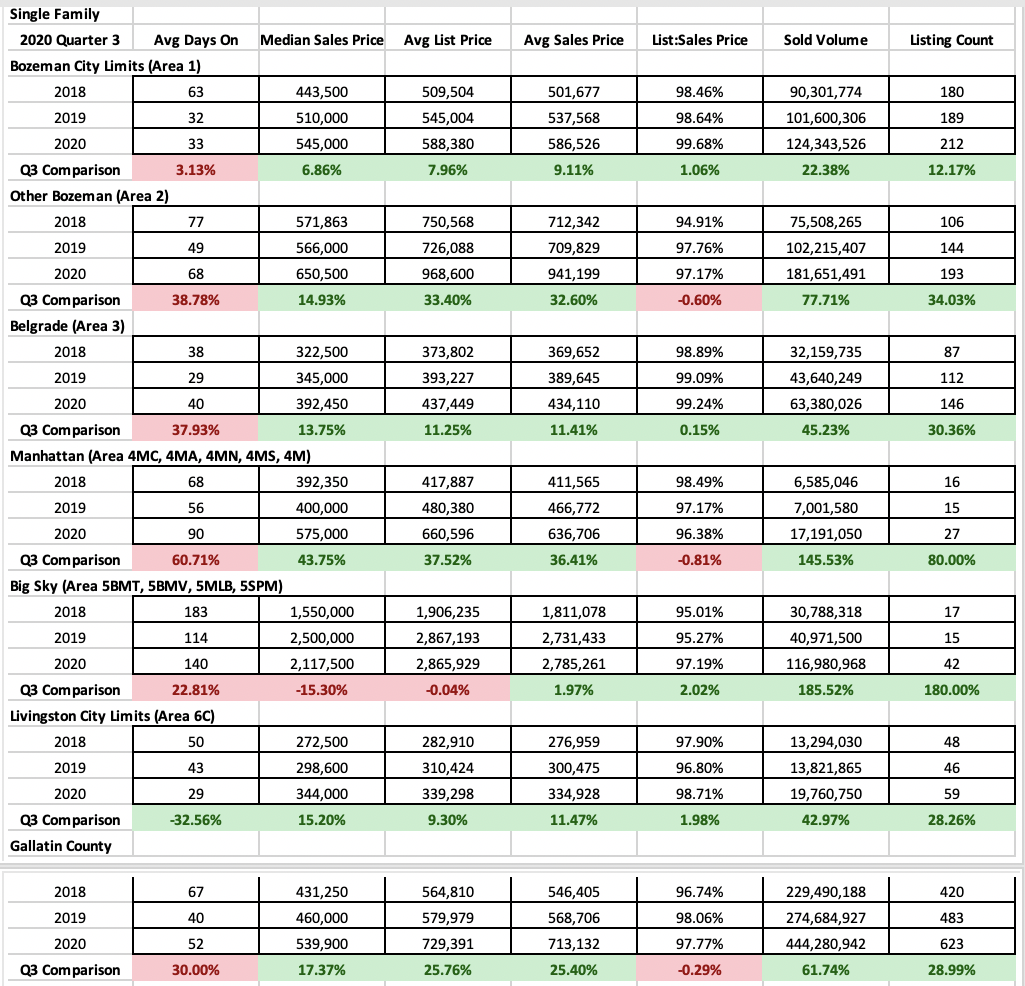
Single family
Single family home sales were very strong in Q3 2020 as buyers competed for limited inventory – however, there are some finer nuances in our market that are very interesting. Across the board number of units sold is up over 2019. Number of units sold has skyrocketed year over year with record breaking gains of 12% in City of Bozeman and 28% in Livingston City Limits – but those are just the lower numbers! Anything with a rural or resort feel and land has flown off the market with a 34% increase in greater Bozeman, 30% gains in greater Belgrade, 80% gains in Manhattan, and 180% gains in Big Sky.
Median sales prices are up but this is where things get interesting. They are only up 7% year over year in City of Bozeman limits which is typically the leader of the pack for appreciation. Buyers are pushing for properties with either elbow room or affordability – as a result just outside Bozeman city limits median prices have jumped 15%, Belgrade has jumped 14%, Manhattan has jumped 44% and Livingston has jumped 15%. Big Sky actually dropped 15% as more properties have sold of varying age and finish – bringing the median price down.
List to sales price ratios show that there was some discounting happening on average but not much. Ratios are very tight in City of Bozeman and Belgrade with 1% or less discounting on average between list price and sales price and all other areas are seeing between 2-3+% discounting on average.
At end of Q3 there was less than one month’s supply of inventory available on market for City of Bozeman, Belgrade, and Livingston. There is less than 2 months of supply of inventory for greater Bozeman, greater Manhattan, and less than 3 months of supply of inventory for Big Sky.
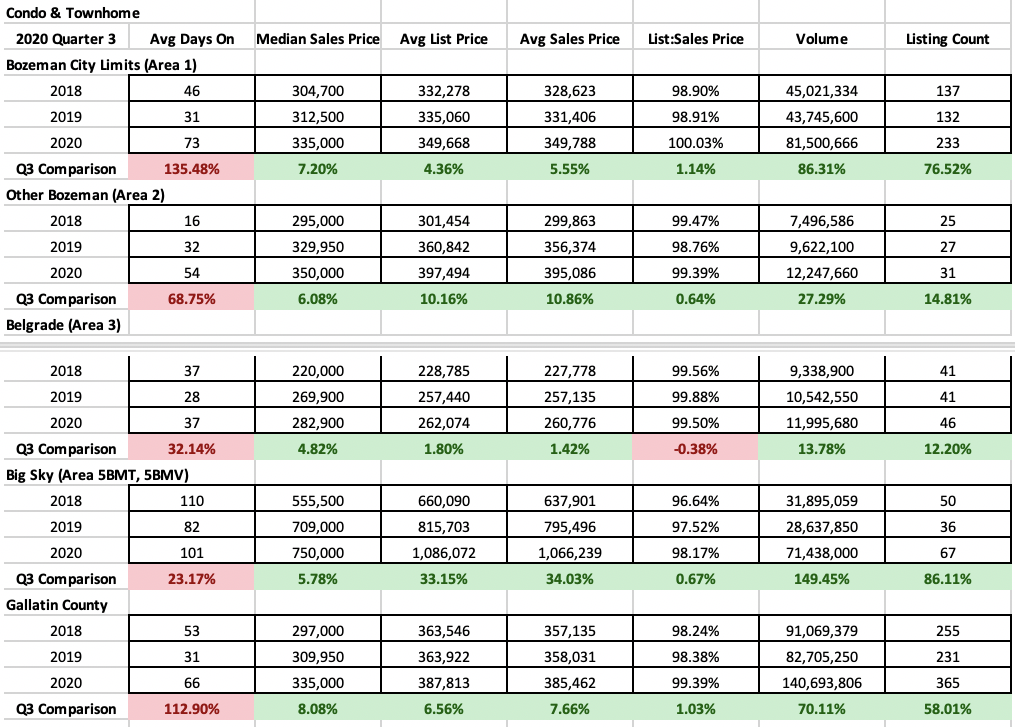
Condo and townhomes
Condo and townhome sales have been white hot prior to the rush on Montana real estate and they continue to accelerate. The number of listings sold is again record breaking – in City of Bozeman they are up 76%. Big Sky is up 86%. Outside Bozeman limits is up 14% and Belgrade is up 12%. Median sales prices have increased in the 5-8% range in all areas – condos and townhomes tend to be a more ‘affordable’ choice with exceptions at the luxury level – at the luxury level choices tend to be based on amenities and ease of living.
List to sales price ratios show a very strong sellers’ market in all geographic areas with very little discounting.
At end of Q3 there was less than one month of supply of inventory available on market for City of Bozeman, Belgrade, less than 2 months inventory for greater Bozeman and less than 4 months inventory for Big Sky.
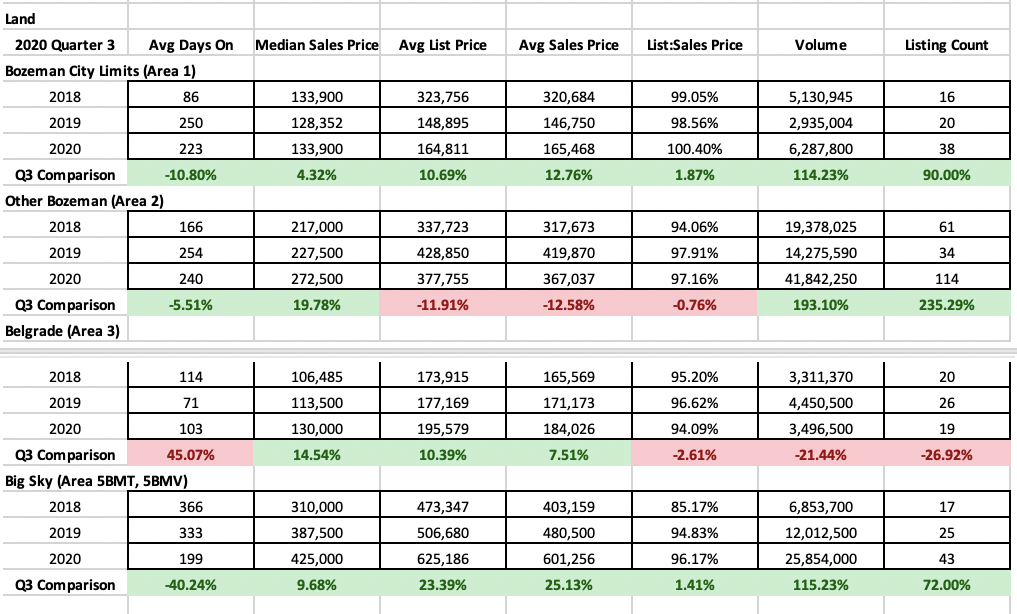
Land
Land sales have shot up in many areas of our market and are limited in others by little to no inventory. Number of listings sold is also record breaking – in City of Bozeman there was a 90% increase. Greater Bozeman area saw a 235% increase fueled by several new subdivisions released in Q3. City of Belgrade is down 27% but there is little to no new inventory available after a couple years of high-pressure land sales in the new neighborhoods in the NW side of town. Big Sky was up 72%.
Median sales prices show continued strength as lack of quality inventory fuels pricing – City of Bozeman was up 4%, greater Bozeman area was up 20%, City of Belgrade was up 15% and Big Sky was up 10%.
List to sales price ratios show little discounting if any at all in City of Bozeman – properties are moving for list price or higher. In greater Bozeman area discounting of about 3% was average. Belgrade saw discounting of about 6% on average and big sky saw discounting of around 4% on average.
At end of Q3 there was less than 3 months of supply in City of Bozeman, less than 5 months of supply in greater Bozeman area, 4 months of supply in greater Belgrade and less than 7 months of supply in Big Sky.
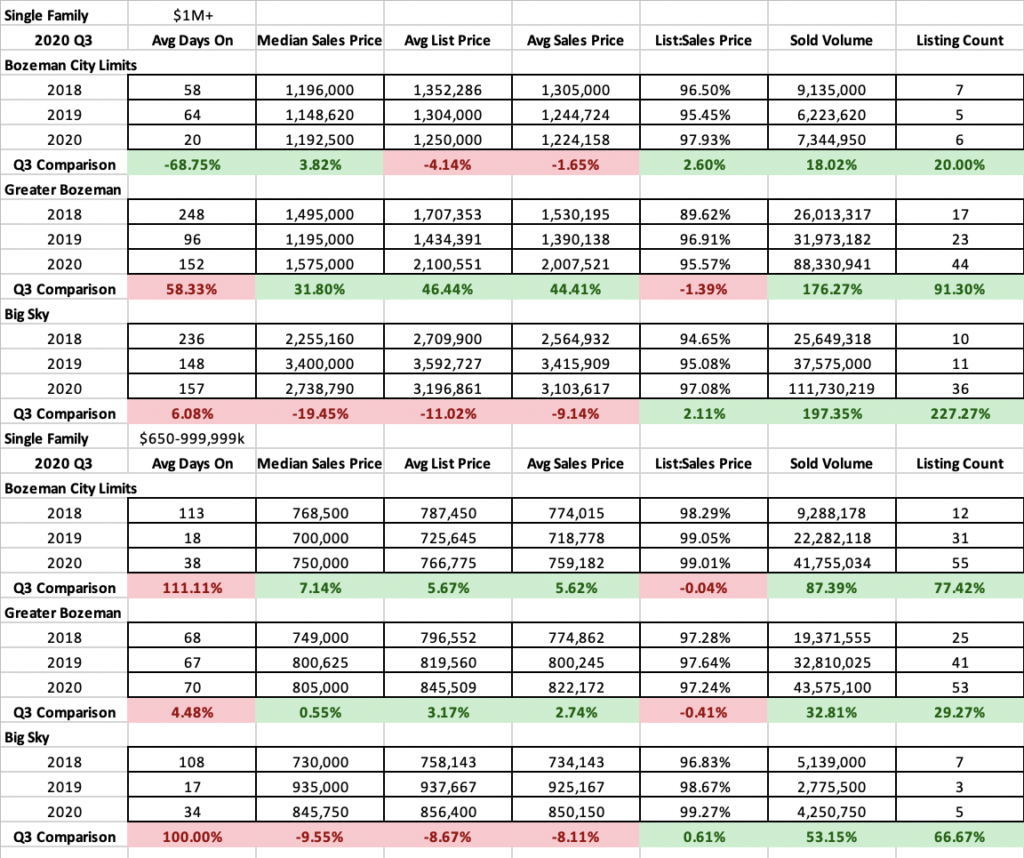
High end and luxury single family
High end home sales – those between $650,000 and $999,999 – saw some huge increases in Q3. Number of units sold in City of Bozeman was up 77%, in greater Bozeman area was up 30% and
Big Sky was up slightly with just 2 more sales than Q3 2019.
List to sales price ratios show that there was very little discounting between list to sales price in the City of Bozeman and Big Sky areas at this price point – less than 1% on average. Greater Bozeman area saw 2.75% discounting on average.
Luxury level home sales – those exceeding $1,000,000 – saw an increase across the board of number of listings sold. Up slightly in City of Bozeman with just one sale more than 2019 Q3. Up significantly in greater Bozeman area (44% over the year prior) and up through the roof in Big Sky (227% over the previous year).
List to sales price ratios for luxury level single family homes sales indicate that there remains discounting of between 3-4% on average throughout the area.
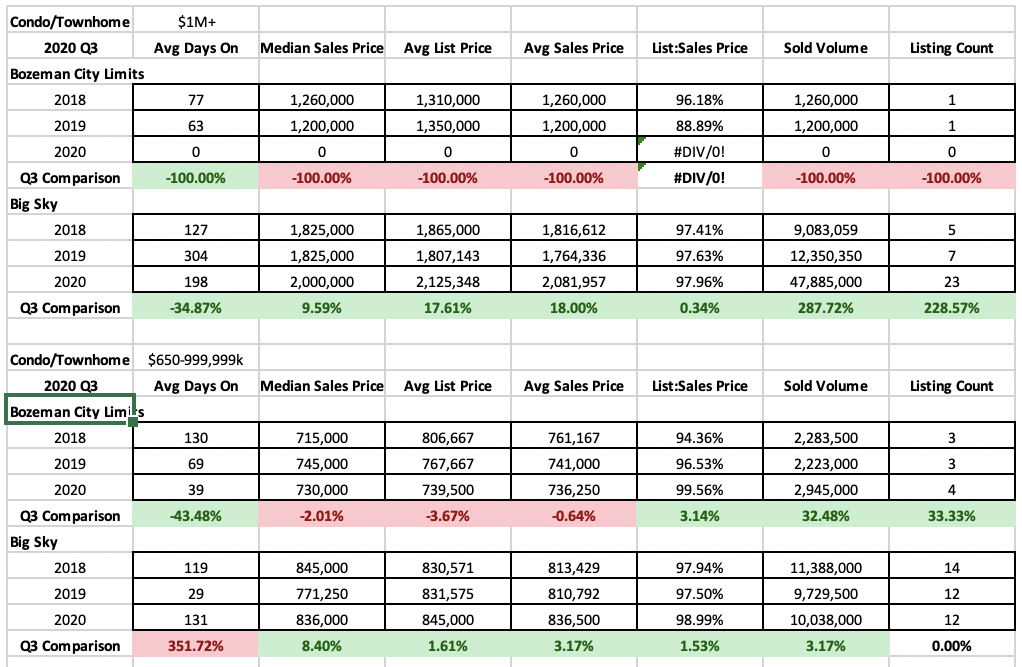
High end and luxury condo and townhomes
High end condo and townhome sales – those between $650,000 and $999,999 – saw about the same volume in Q3 2020 as Q3 2019. This is indicative that the surge of buyers at this price point may be more frequently looking at single family homes – but the market is steady. Discounting was little to none in City of Bozeman with less than 0.5% on average. Big Sky saw slightly more at just over 1.5%.
Luxury level condo and townhome sales – those exceeding $1,000,000 – are still not gaining a ton of traction in City of Bozeman – there is actually quite a bit of pending inventory that will begin to close once new construction projects are completed. Indicative that buyers in this market may be gravitating towards single family homes instead. However, condo and townhome sales at the luxury level in Big Sky have boomed – up 228% over the year prior. This is fueled by new projects and resales in Town Center, Meadow Village, Big Sky Mountain, Moonlight Basin and Spanish Peaks. There are currently 53 pendings that will continue to fuel this market as these projects close and are completed.
We have also been tracking buyer state information from our MLS database. Here is the quarterly buyer origin report for our market organized by major area.