


Single Family
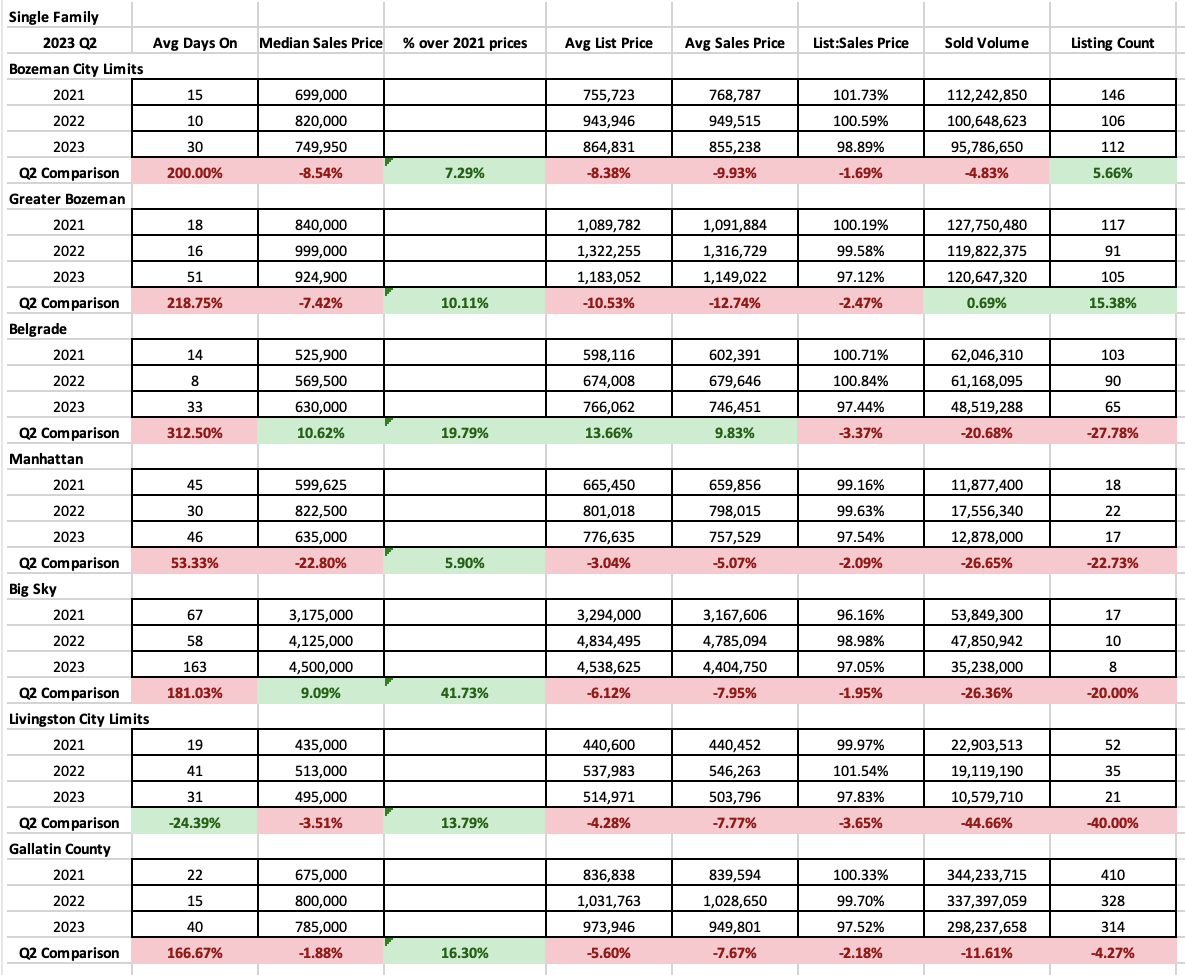
The slowdown in median sales price appreciation in Southwest Montana for Single Family homes that we have observed since late 2022 spring and that continued throughout the remainder of 2022 and start of 2023 continues to dominate the data. However, there are some very interesting data points worth highlighting. The number of homes sold during Q2 2023 over Q2 2022 has INCREASED in City of Bozeman and Greater Bozeman – perhaps buoyed by buyers both getting used to increased interest rates and jumping into the market in 2023 and lower prices than 2022. In other areas, sales numbers are off anywhere from 20-40% including Belgrade, Big Sky and Livingston.
It is also worth noting that while median sales prices in most tracked areas have dropped 3-8% – except for Belgrade which has INCREASED over Q2 2022 by 10% mostly due to new construction product – that the increase over 2021 prices remains between 7-42% depending on area. There has been value peeled back over 2022 in general, but prices appear to be leveling and even increasing in some areas due to a rise in multiple offer situations.
Days on market have increased significantly as a combination of slower paced buyers, continued high interest rates and low inventory have combined to tamp demand over Q2 2022. The days on market are higher than they have been since 2020 – but are in line with what we had experienced for days on market prior to the Pandemic boom.
New listings brought to market are down in all areas in Q2 2023 over Q2 2022 apart from Belgrade (due to new construction product). Inventory depth is still shrinking.
List to sales price ratios show that on average buyers are discounting 2-3% off list price in all areas – this is very indicative of a very balanced market.
Condo & Townhome
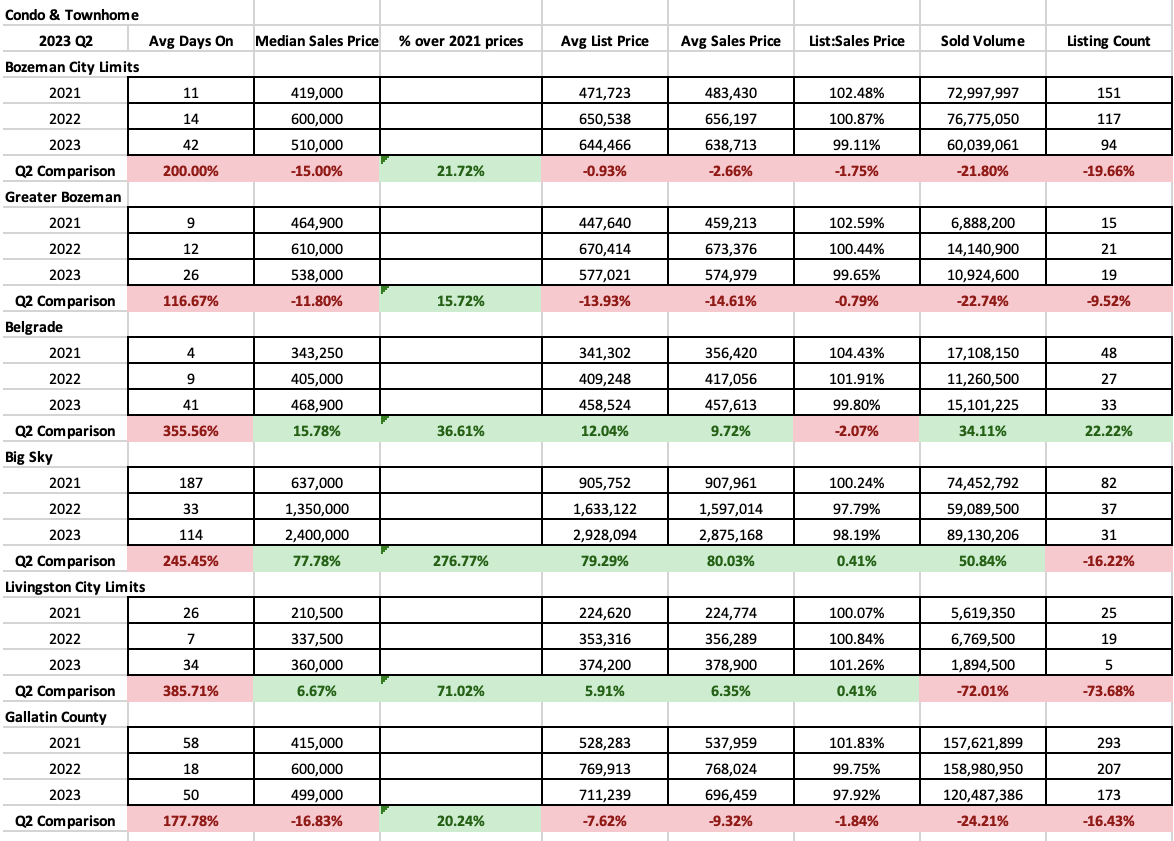
Condo and Townhome sales have some very interesting data points. As expected, median sales prices for condos and townhomes in the areas tracked show a drop in pricing in City of Bozeman and greater Bozeman Q2 2023 over Q2 2022. But in Belgrade, Livingston and Big Sky, median sales prices have continued to heat up, mostly due to new construction product in both markets.
As with single family sales, condo and townhomes have experienced a sizeable increase over 2021 prices remains between 15-37% in the areas tracked in the valley and a whopping 275% in Big Sky.
Number of listings sold is down in all areas apart from Belgrade (where new construction has kept inventory flowing). Number of new listings Q2 2023 over Q2 2022 shows a decline in all areas.
List to sales price ratios show minor discounting of 1-2% in all areas except for Livingston which is closing above list price on average. This is indicative of a slightly tilted seller’s market for these products.
Land
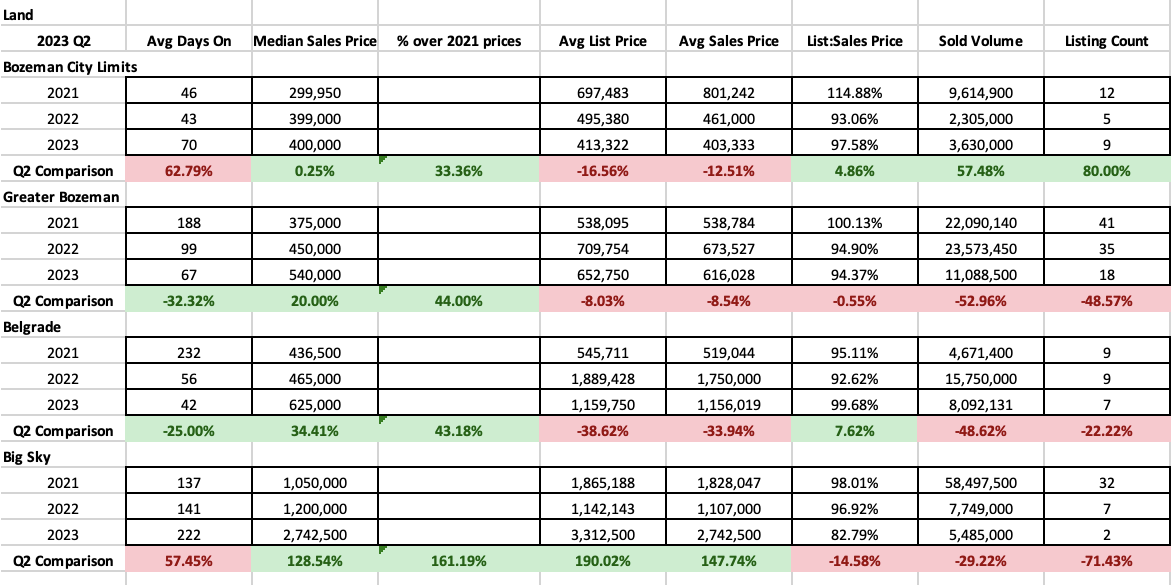
Land is typically the ‘last to rise and first to fall’ in a changing market. So, we use it as a bit of a barometer. Number of land sales are off in greater Bozeman, Belgrade and Big Sky but up in City of Bozeman significantly over 2022. Overall depth of inventory is growing slightly but not quickly.
Median sales price for land is relatively flat Q2 2023 over Q2 2022 in the City of Bozeman but has rocketed in Belgrade (34%), Greater Bozeman (20%) and Big Sky (128%) year over year. Showing continued high demand by buyers with discretionary funds.
List to sale price ratios shows a balanced market in Bozeman with 5% buyer discounting off list price – stronger than this same Q2 time in 2022. Greater Bozeman is about the same year over year at 6% discounting. Belgrade had less than 1% discounting on average as buildable lots become scarcer. Big Sky saw a big increase in discounting – up to 17% on average – as list prices have risen to uncharted territory.
High End & Luxury
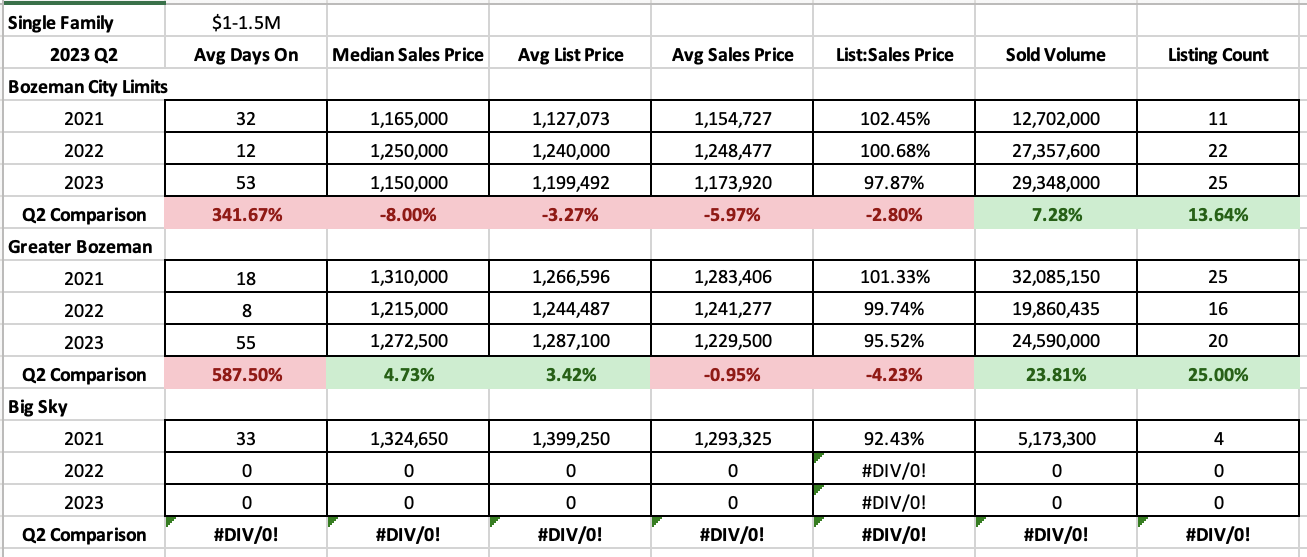
High-end single-family home sold listings (those $1M-$1.5M in closed price) in all areas tracked showed no new listings sold in the Big Sky are for the 2nd straight year in this price point and a significant uptick of solds over Q2 2022 in City of Bozeman and the greater Bozeman area – with 14% more properties selling in City of Bozeman and 25% more properties in greater Bozeman. Days on market are up significantly in this sector of the market – with close to two months on average prior to getting an offer (up from about a week in 2022). List to sales price ratios show buyers discounting 3-5% on average – up from almost no discounting in 2022 – indicative of a balanced market.
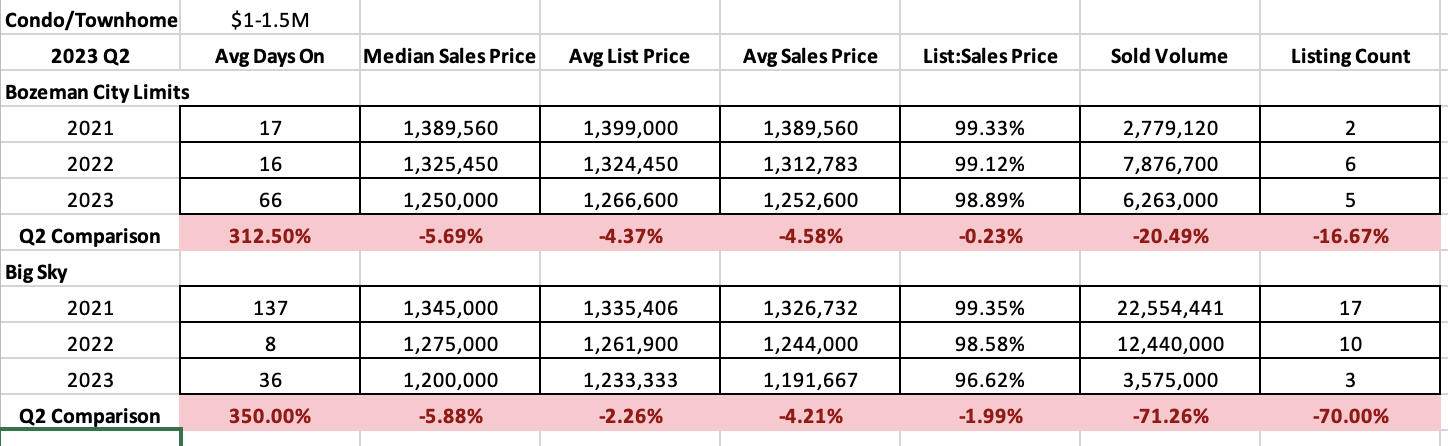
High end condo and townhome sales (those $1M-$1.5M in closed price) showed reduced sold listings in the Big Sky area, the third straight year of declines as prices move out of this bracket. Listings sold were also down slightly in the City of Bozeman area. Days on market have accelerated to 2 months (up from 2 weeks in 2022) in City of Bozeman and up to month in Big Sky (up from 1 week in 2022).

Luxury single family home sold listings (those $1.5M+ in closed price) were down in number significantly between Q2 2022 and Q3 2023. Number of listings sold in City of Bozeman were down 80%, in greater Bozeman were down 25% and were slightly down in Big Sky 20%. Days on market are also up significantly – up to 3.5 months in City of Bozeman (from 2 weeks in Q2 2022), up to 2.5 months in greater Bozeman (from 1 month in Q2 2022) and up to 6 months in Big Sky (from 2 months in 2022). List to sales price ratios show increased discounting in Q2 2023 over Q2 2022 with 3-5% on average in all areas. This is still indicative of a very balanced market.
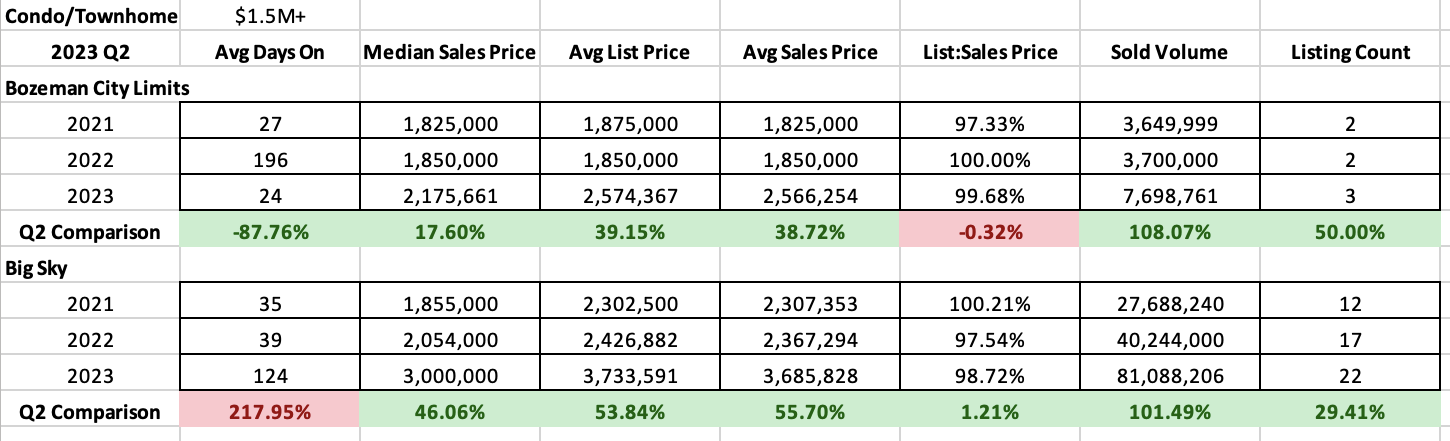
Luxury condo and townhome sales (those $1.5M+ in closed price) have had a significant uptick on solds in both the City of Bozeman and Big Sky. Days on market are down in Bozeman city limits (partially due to solds being built inventory) and up in Big Sky (partially due to it being new construction inventory dominant). List to sales price ratios show very little discounting – 1.5-3% on average – off list price in general. Indicative of a balanced, stable and slightly seller tilted market.