


For a graphical chart version of this information, please visit our Market Stats page.
Single Family
The Q2 2021 real estate market remained red hot for single family homes in the SW Montana. Looking back a year, Q2 2020 was the most adversely affected quarter due to the pandemic – though it showed modest gains in median sales price appreciation over Q2 2019 – typical to above average median sales price appreciation for Bozeman, greater Bozeman, Belgrade, Manhattan ranging from 7-17% – flat appreciation for Livingston and the acceleration trend in Big Sky at 35% – had already begun. Number of listings sold was below average or average for that same period of time.
Fast forward to Q2 2021 and the price appreciation has continued to accelerate. Year over year for Bozeman, median sales prices were up 45% for single family homes. Greater Bozeman 30%. Belgrade 46%. Manhattan 23%. Big Sky was flat. Livingston 45%. Number of units sold were up over Q2 2020 but Q2 2020 had a reduced number of units sold due to the pandemic. Number of units sold is down in most areas from Q2 2019’s stats. Illustrating the continued lack of depth of inventory for the amount of demand that continues to funnel into our area. Dollar volume of solds for the market however is well above both 2019 and 2020s numbers in all areas – illustrating the jump in pricing across all areas.
List to sales price ratios – an indicator of market competition as it shows how much discounting buyers are taking off list price– shows an extremely strong seller’s market in all areas. On average, homes in Bozeman in Q2 were selling for almost 2% over list price, Belgrade, Livingston, Manhattan Greater Bozeman in Q2 were selling for at or just slightly below 100% of list price. This illustrates almost NO discounting by buyers in these markets. Big sky had on average 3% discounting on list pricing.
We’re continuing to see many multiple offer situations, though with a bit more inventory filtering on the market less so than earlier this spring, with closed prices extending 5% 10%, 15%, 20%, even 25% over asking in some circumstances.
Condo/Townhome
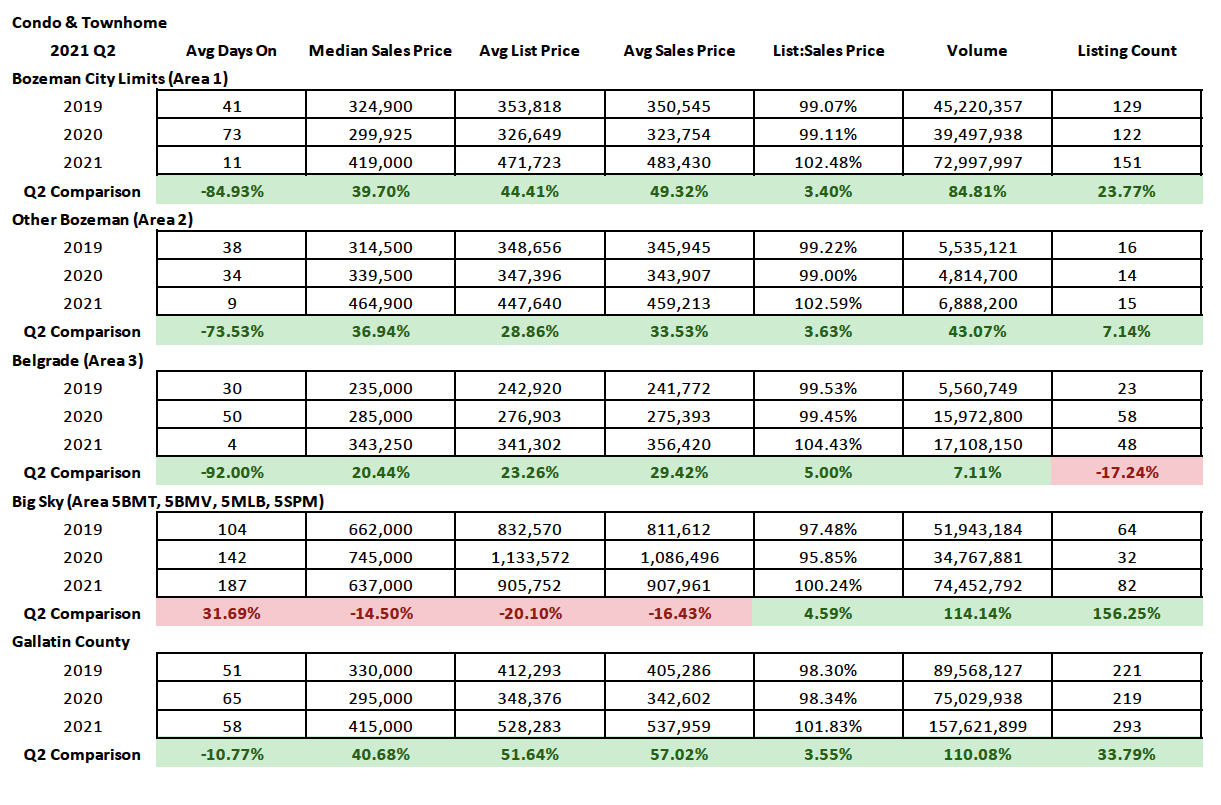
Condos and townhomes are seeing some of the biggest appreciation. Condos and townhomes were more affected by the pandemic in Q2 2020 than single family homes – likely due to those buyers that were buying wanting more elbow room from their neighbors and outside space. However in Q2 2021, the condos and townhomes have seen skyrocketing median sales prices in all areas except Big Sky – partially because there was a much needed an affordable housing project that closed a slew of units in Q2 2021 in the Meadow Village. Median sales prices have been well above 2019 and 2020 prices. In most areas the number of units sold has also been fairly constant or grown, with the exception of greater Bozeman and Belgrade as new construction on these products has waned. List to sales price ratios are over 100% in all areas tracked, with averages 2.5% over list price in Bozeman and Greater Bozeman. 5% over list price in Belgrade and 2% over list price in Big Sky.
Land
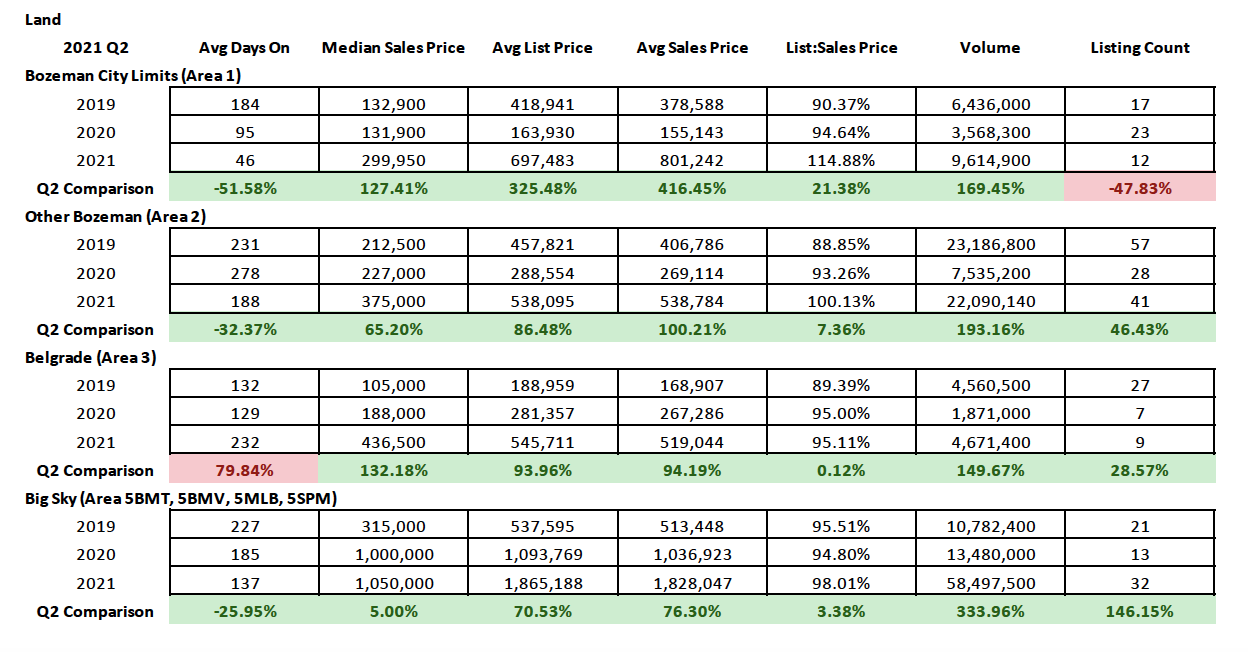
Interest in land in SW Montana has spiked over the past year, with land sales moving at an accelerated pace in many areas – when and where inventory can be found. Median sales price has climbed 127% for City of Bozeman lots, 65% for greater Bozeman lots, 132% for Belgrade area lots and 5% in Big Sky where pricing had already started to spike in 2020. For Big Sky, prices between 2019 and 2021 have gone up 233%. Number of units sold has increased over 2020 in all areas except Bozeman. However, due to Q2 2020 being the most heavily affected by the pandemic, this was an easy feat to accomplish. Only Big Sky is ahead of where number of sales were in 2019. The rest of our tracked areas are bumping along at sold numbers far below where they were in 2019. Partially due to lack of new subdivisions available for lot purchase. There are projects in the pipeline but there is still quite a bit of time to wait until many of these projects will be released to the open market.
High End and Luxury

Single Family
*Due to volume constraints, we only track high end and luxury sales in City of Bozeman, Greater Bozeman and Big Sky
High end ($600,000-$999,999 priced homes)
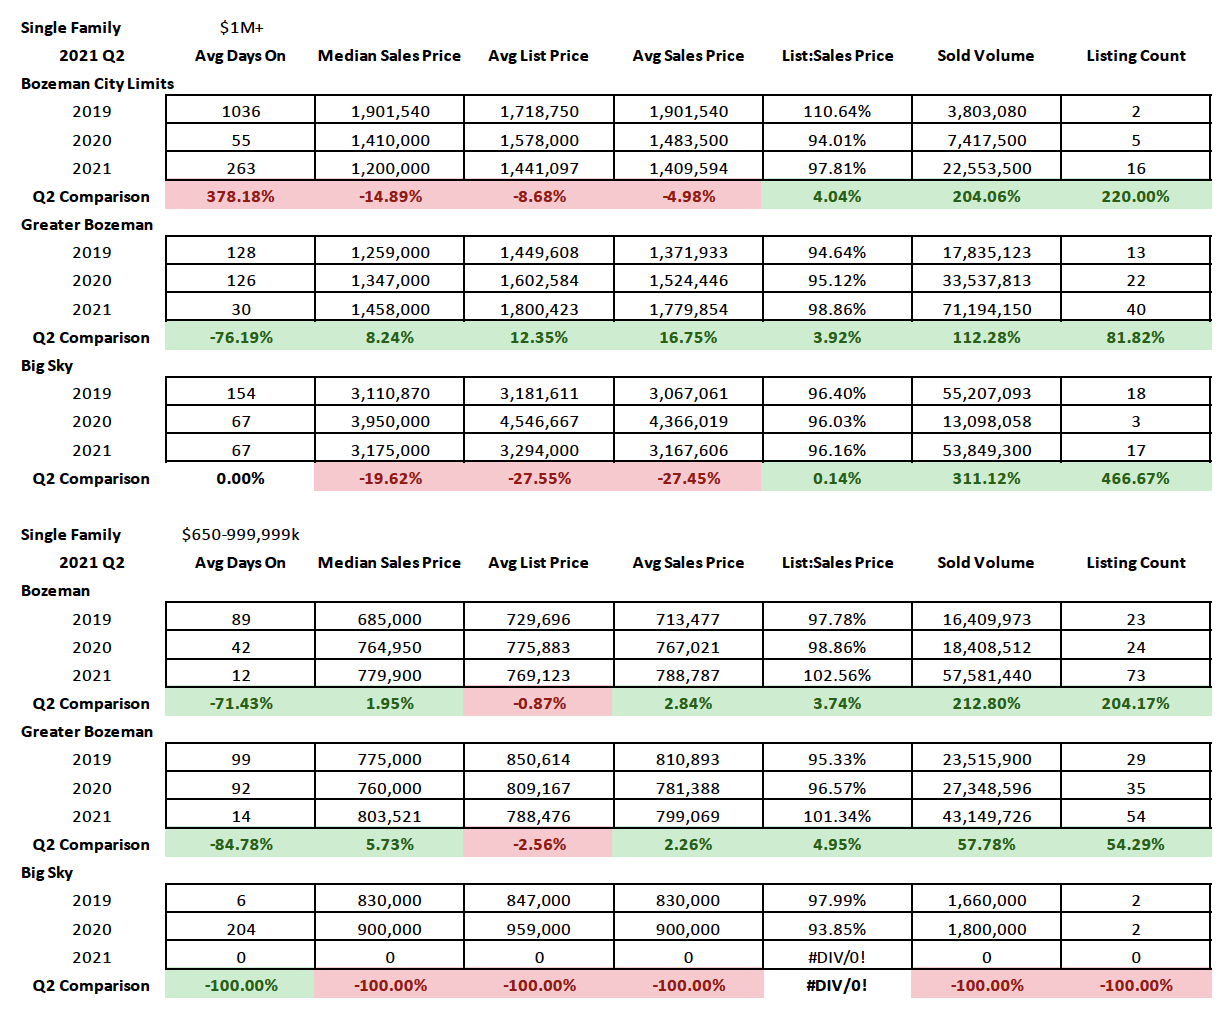
The number of units sold for high-end single-family homes in Bozeman spiked in Q2 2021 with almost 3x as many home sales in this price point then in the past. Greater Bozeman saw a 54% increase in number of sold properties. Big Sky had no homes under $600,000-$999,999 that sold in Q2 2021. City of Bozeman homes were going for 2.5% above asking in this price point in Q2 2021 and 1.3% over asking in Greater Bozeman area. Days on market were down to 12 days on average in City of Bozeman for this price point and 14 days in greater Bozeman.
Luxury ($1M+ priced homes)
The number of units sold for luxury homes in Bozeman and Greater Bozeman spiked in Q2 2021 as median sales prices for the overall single family home market skyrocketed. Luxury sales median sales prices were up 220% in Bozeman and 81% in greater Bozeman. Big Sky jumped 466%. Dollar volume was up 204% in City of Bozeman over Q2 2020 (and 492% over 2019), 112% in greater Bozeman and 311% in Big Sky. Days on market were about the same (2 months) in Big Sky. City of Bozeman saw a jump in days on market as the stale listings in the luxury market were absorbed. Still down significantly over 2019. List to sales price ratios show homes were going for around 3% off list price in City of Bozeman, 1% off list price in Greater Bozeman and 4% off list price in Big Sky on average in Q2 2021.
Condo & Townhome
*Due to volume constraints, we only track high end and luxury sales in City of Bozeman and Big Sky
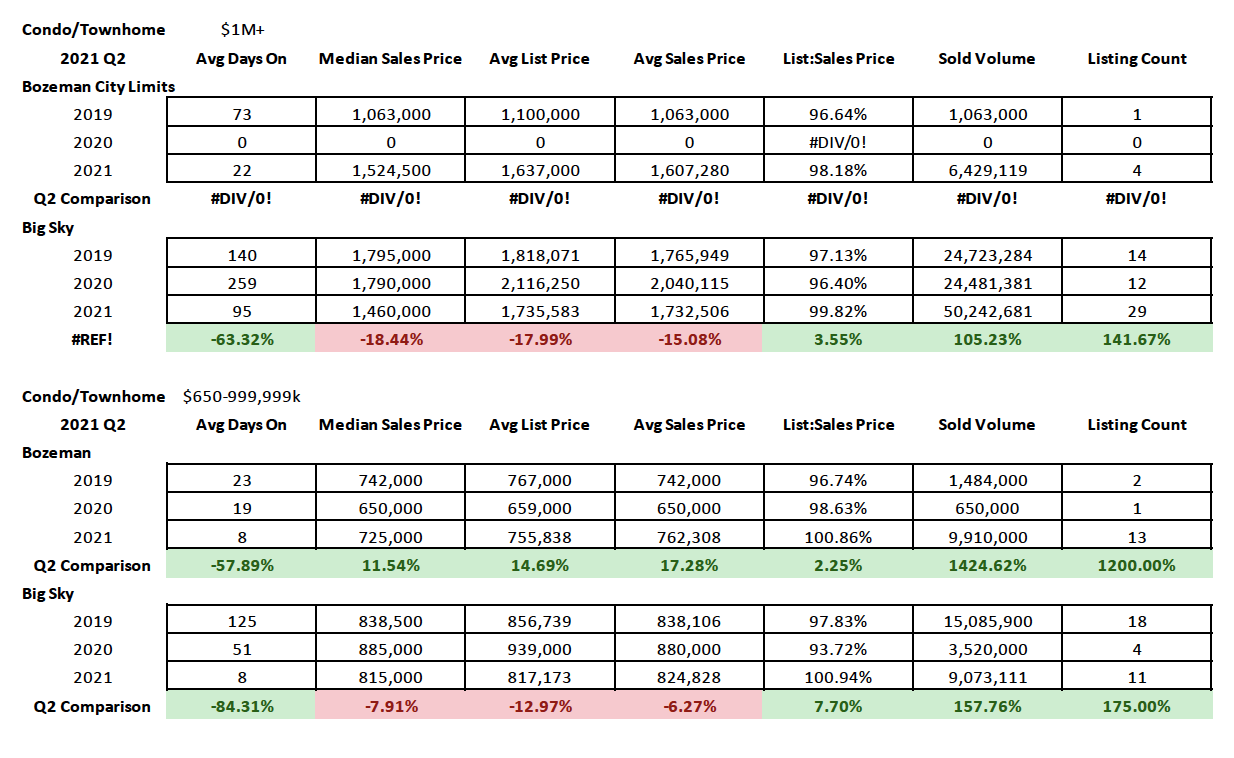
High end ($600,000-$999,999 priced condos and townhomes)
The number of units sold for high end condos and townhomes leapt in the Bozeman area in Q2 2021 as median sales prices climbed. The most units sold in historical data in this price point occurred in Q2 2021. Big Sky experienced a jump in number of units sold over 2020 but is down 38% from 2019. Volume is up 1425% in City of Bozeman (that is not a typo) over 2020 and is up over 567% over 2019. Volume is up 147% in Big Sky over 2020 but is actually down over 40% from 2019. List to sales price ratios show that buyers were paying almost 1% over asking price in Bozeman and Big Sky on average.
Luxury ($1M+ priced condos and townhomes)
The number of units sold for luxury condos in Bozeman was at an all-time high in Q2 2021 as it was for Big Sky. Big Sky was up 140% year over year. Big Sky also saw list to sales price ratios narrow with just a 0.1% discounting on average off list price. Bozeman was closer to 1% off list price on average. Dollar volume doubled in Big Sky – up 105%. Bozeman saw a 500% increase off 2019 sales.
Please contact us with questions or for more information – this is a statistical analysis for Q1 2021 and is a snapshot in time off BSCMLS as of July 10, 2021.