


View illustrated charts and graphs at https://knoffgroup.com/market-stats/
Single Family Homes
Single family home sales have seen marked price appreciation between Q2 2019 to Q2 2020. The majority of this appreciation was in the pre-COVID-19 period, with a robust 2019 and early 2020 push and then a drop to end of 2019 values. However, this appreciation appears to be ramping back up now, delayed from early spring into the summer market season – and we’ll likely see it in our Q3 reporting. Real estate transactions take 45-60 days on average to close if financing is involved. As a result, in our reporting there is a lag/delay in what offer prices are being placed today and when we have empirical data. Had there been no pandemic, 2020 was on track to be off the charts record appreciation.
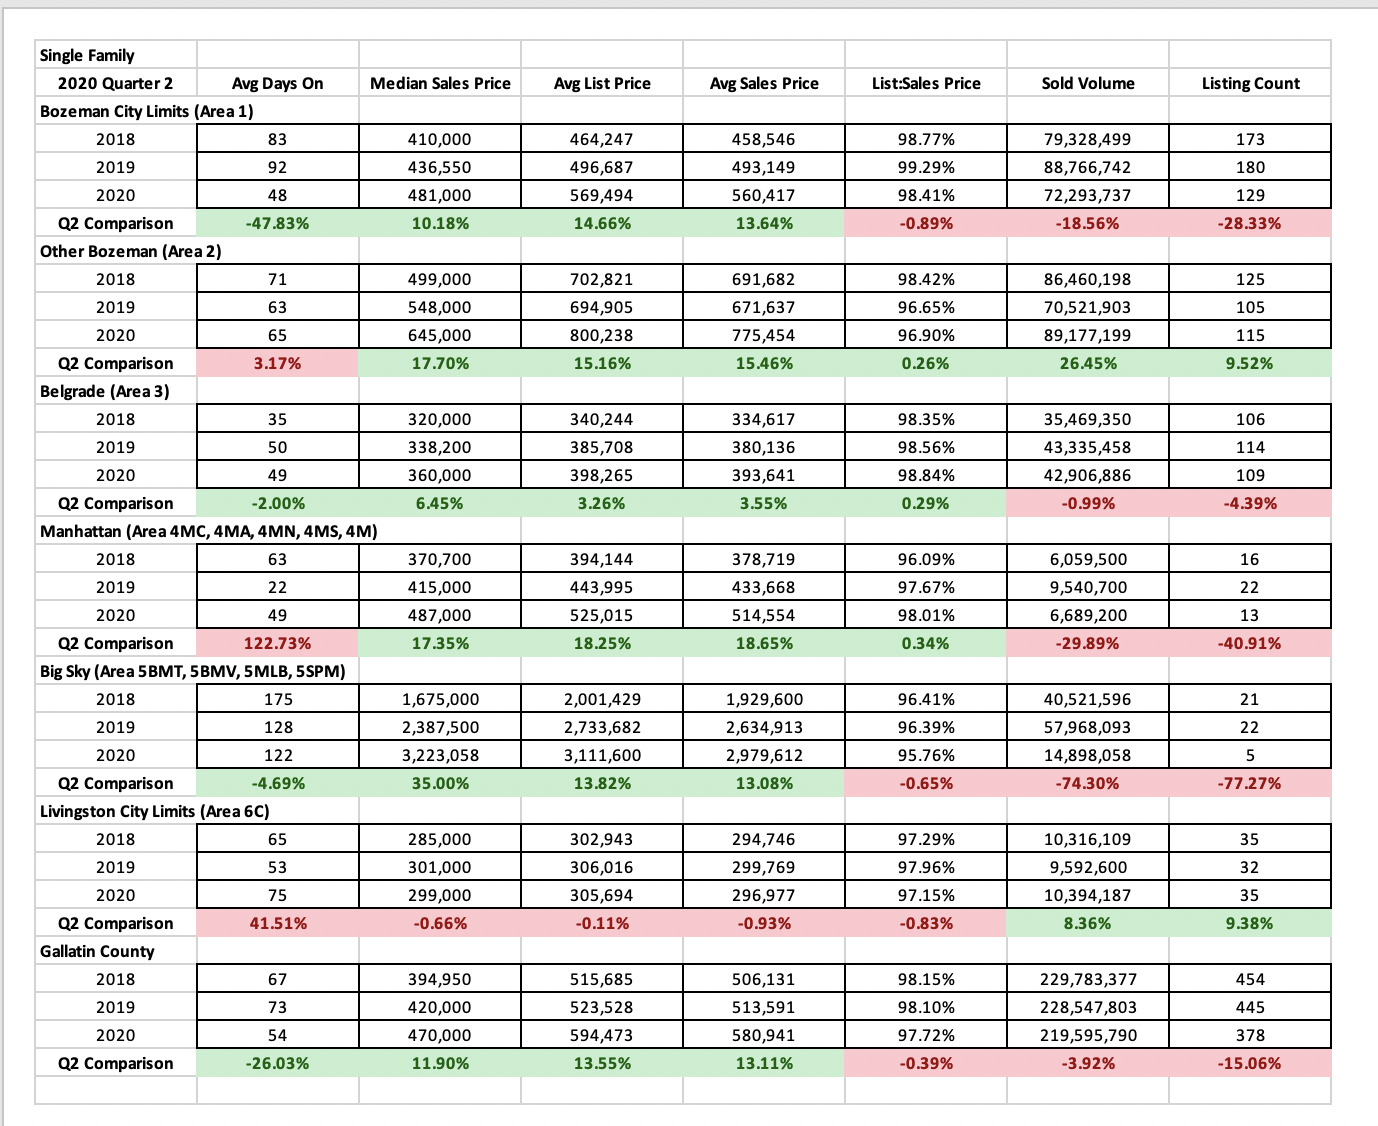
City of Bozeman saw 10% appreciation year over year but was flat in median closed sales price during Q2. Greater Bozeman saw a 17.5% appreciation year over year but had a drop in median closed sales price in June. Belgrade saw a 6.45% appreciation with a drop in June. Big Sky saw a 35% Y/Y appreciation with a sharp drop in May and June. Manhattan saw a 17% Y/Y appreciation but was flat during Q2. Livingston City Limits had a more pronounced U-shaped deflation curve at the start of 2020, and has crept back up to end of 2019 values.
Number of listings sold has dropped substantially in most areas. Number of units sold is down 28% in City of Bozeman, 40% in Manhattan, 5% in Belgrade and 77% in Big Sky. There has been a slight uptick in Greater Bozeman sales at 9% and Livingston City Limits at 9%.
List to sales price ratios – the difference between list price and sales price as an indicator of buyer discounting – are completely flat across the area, with similar discounting to Q2 2019. All areas have strong list to sales price ratios.
Days on market have narrowed significantly in some areas but lengthened or stayed static in most others. City of Bozeman saw a 47% reduction year over year. Interestingly, longer days on market can be an indicator that older inventory is being absorbed. Without the volume of new listings brought to market that we usually see in Q2, days on market lengthened by 41% in Livingston, 122% in Manhattan, 3% in greater Bozeman.
Condos and Townhomes
Condo and Townhome sales have been more all over the map in median sales prices between Q2 2019 and Q2 2020. City of Bozeman saw a 7% drop – prices dropped at the start and then and were flat over Q2, Greater Bozeman a 8% gain, Belgrade a 21% gain and Big Sky a 12% gain.
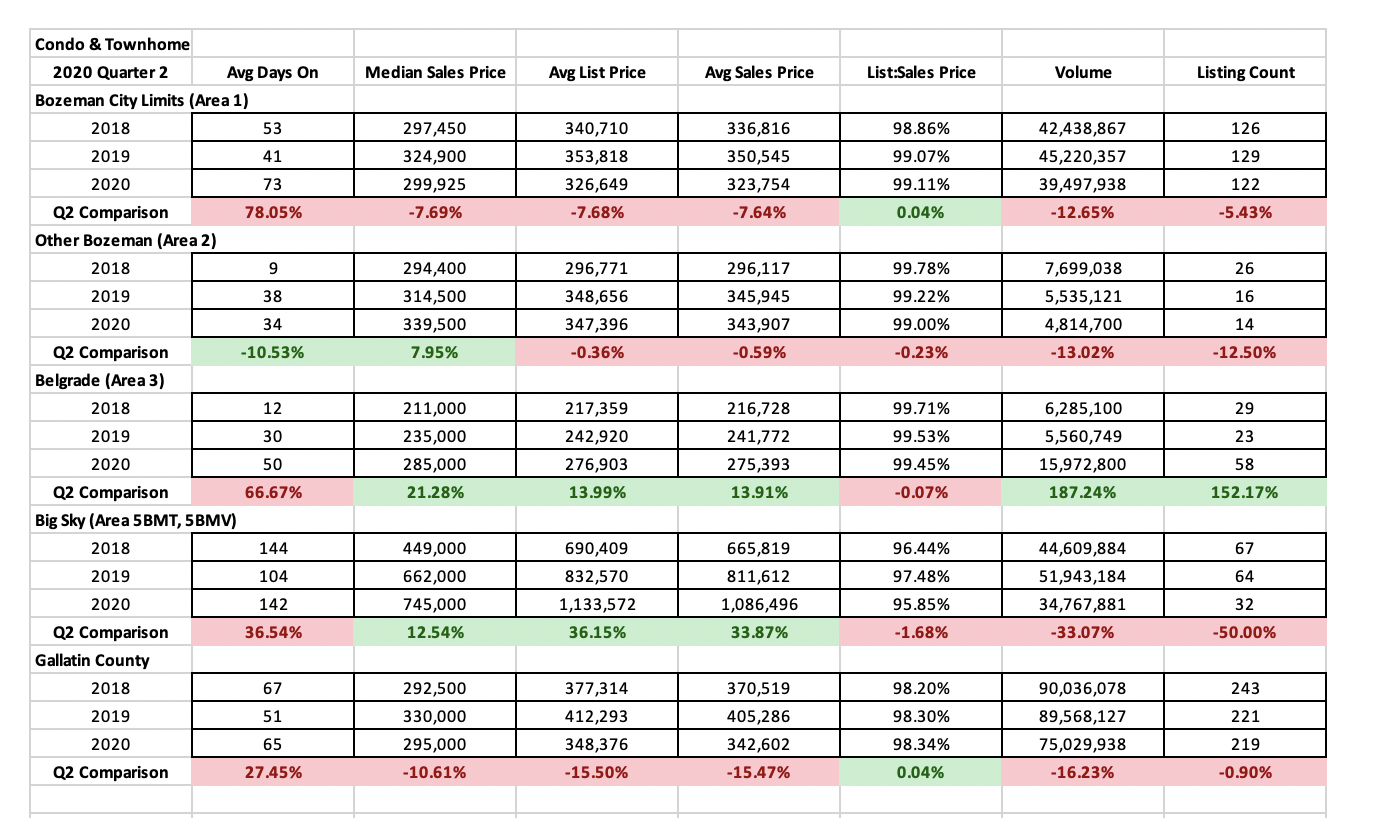
Number of units sold were down year over year in all areas with the exception of Belgrade, which is at the forefront of new construction. City of Bozeman was down 5% Y/Y, Greater Bozeman was down 12% and Big Sky was down 50%.
List to sales price ratios were again flat year over year – over 99% in all markets except Big Sky which was at 95%. Still indicative of a strong seller’s market in most areas.
Days on market were up in almost all areas – again an indication of stale inventory being sold in the wake of fewer new listings during the stay home order.
Land
Land has been a bit of a dichotomy during Q2 – typically it is the first to fall and the last to rise in a volatile market as land is an optional purchase. But land remains very attractive to builders doing spec homes (*who did not slow down during the stay home order as they are considered essential services) – and luxury level buyers that cannot find a home to match their criteria and decide to build instead.
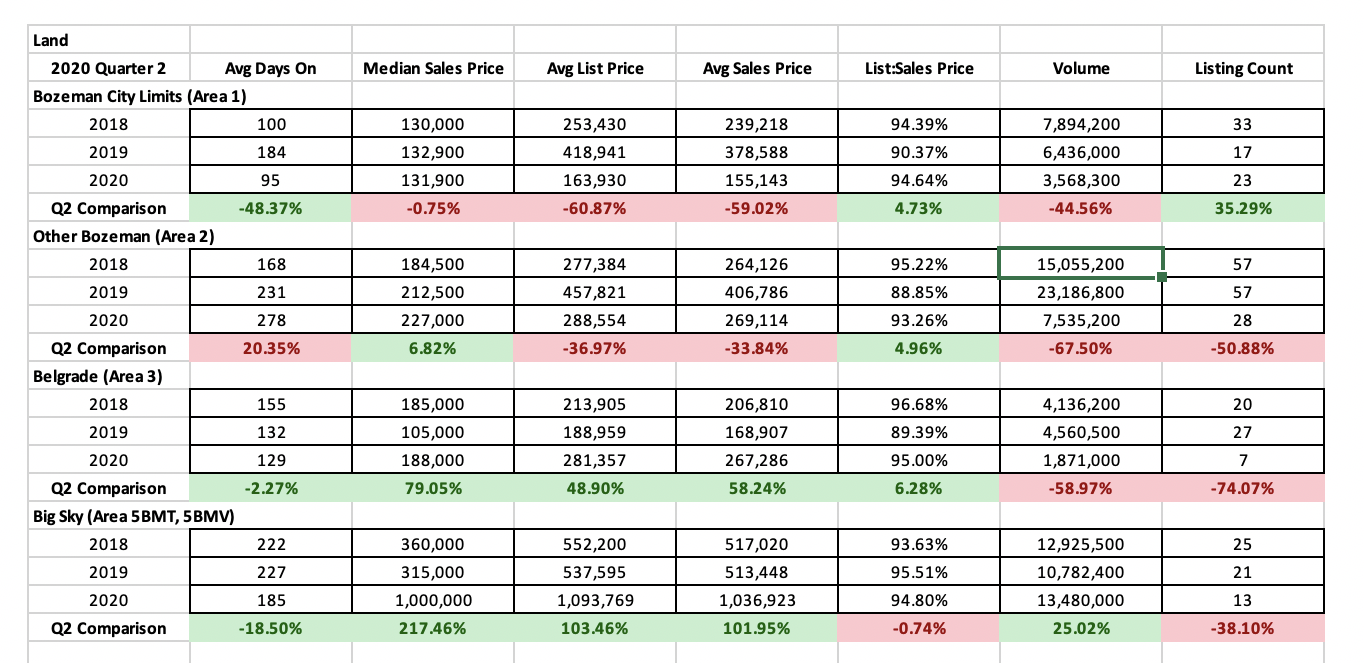
Median sale prices are flat or up – significantly in some areas, year over year. Big Sky has several newer luxury home developments that had sales that pushed median sales price to $1 million, a 217% rise year/year. City of Bozeman was flat. Greater Bozeman saw a 6% rise and Belgrade saw a 79% rise as land has become scarcer in the new construction areas to the NW of town.
Number of units sold were down significantly in all areas with the exception of the City of Bozeman which had a 35% rise. Greater Bozeman was down 50%, Belgrade down 75% and Big Sky down 38%.
List to sales price ratios showed improvement in almost all areas, with a narrowing to 95% in city of Bozeman, 93% in greater Bozeman, 95% in Belgrade and 95% in Big Sky. All are indicative of a balanced market – with less buyer discounting.
Days on market were all over the place, with a 50% reduction in days on market in City of Bozeman, 20% increase in days on market in Greater Bozeman, flat in Belgrade and 18% reduction in Big Sky.
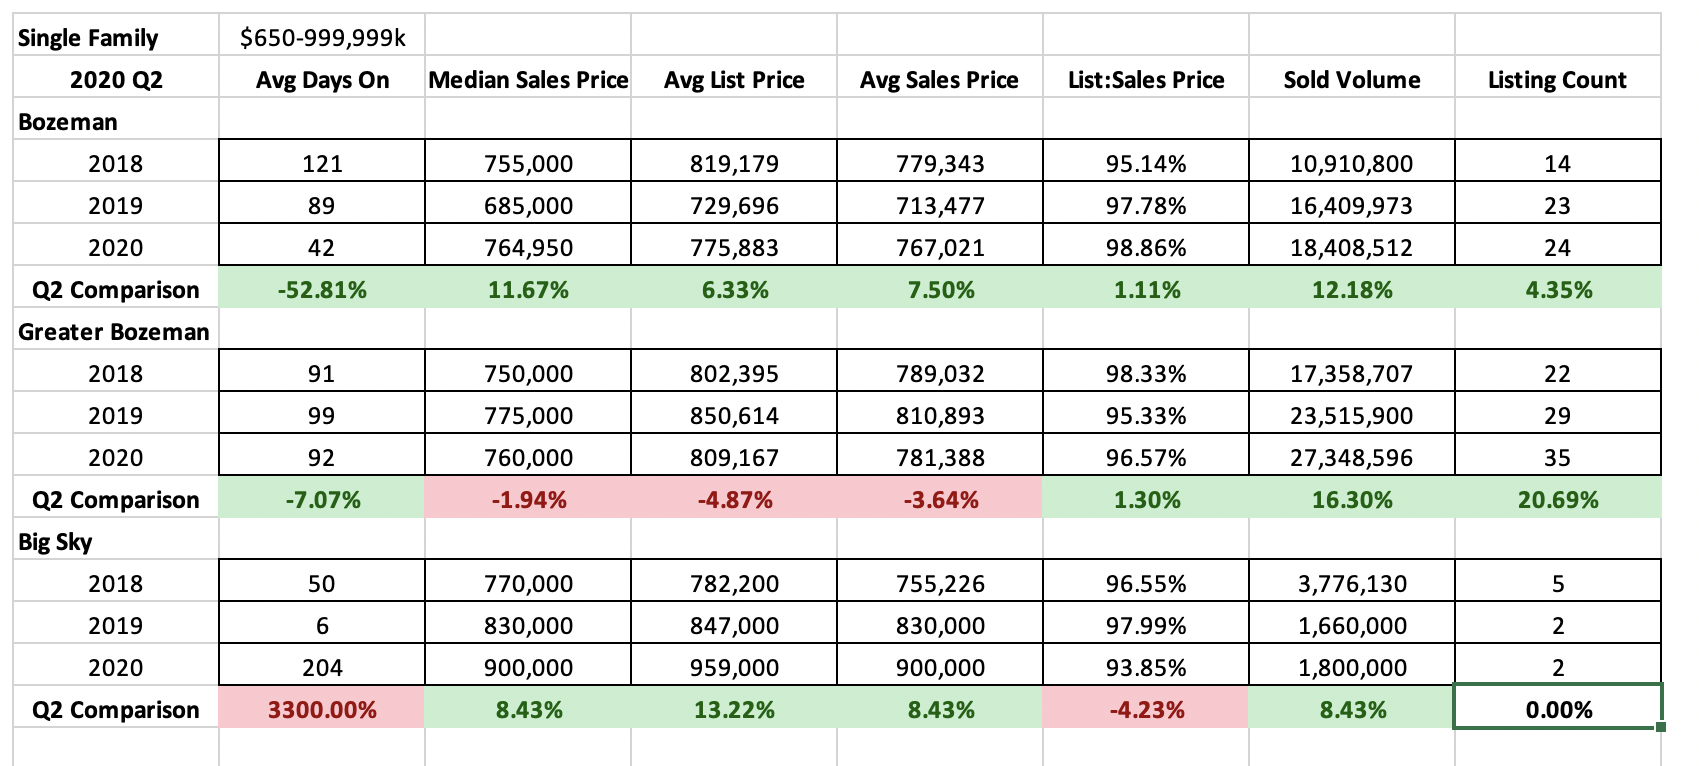
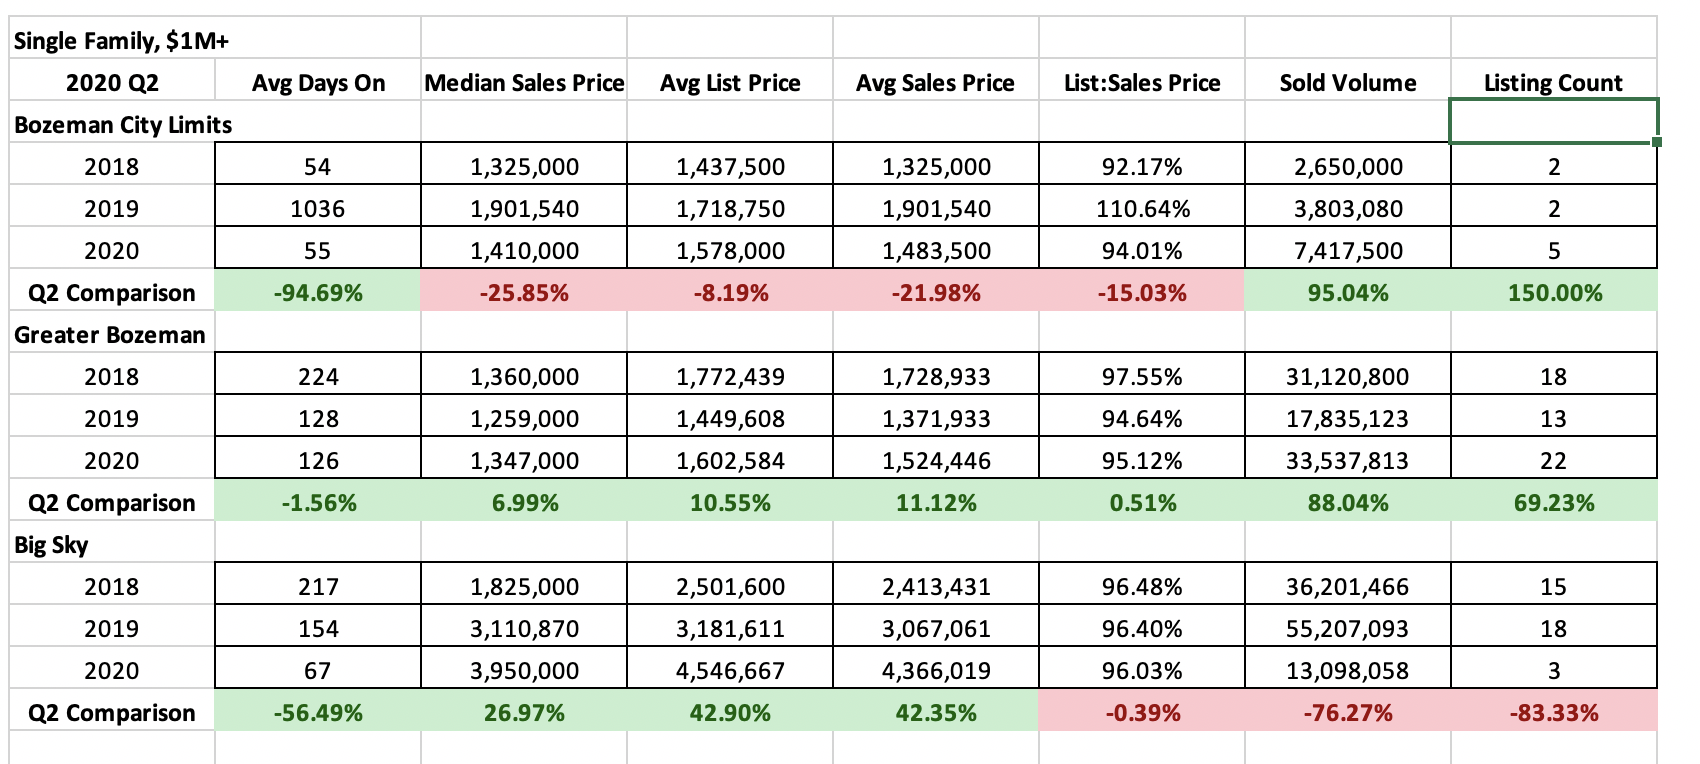
High-end & Luxury Single Family
High end homes – those closed between $650K and $1M – saw a bump in the Bozeman market number of listings sold (up 4%), average days on market down (52%) and list to sales price ratios tightening to almost 99%. Greater Bozeman saw a bump in listings sold (up 20%) days on market down (7%) and list to sales ratios tightening to 96.5%. Big Sky days on market were up significantly – a sign of stale inventory selling – number of listings sold was static and list to sales price ratios showed more discounting by buyers at 94%.
Luxury homes – those closed above $1M – saw a uptick in number of units sold in both City of Bozeman and Greater Bozeman. Big Sky dropped significantly – down 81% from 2019. List to sales price ratios show heavy discounting in the Bozeman market over 2019 but actually strengthening from 2018, with buyers discounting 6% on average. Greater Bozeman saw 5% discounting and Big Sky 4%. Average days on market were reduced in all areas year over year.
High-end and Luxury Condos and Townhomes
High end condos – those closed between $650K and $1M – saw number of listings sold drop significantly in both Bozeman and Big Sky. Days on market for those sold were reduced significantly. List to sales price ratios show some discounting in the Bozeman market (1.5% on average) and discounting in the Big Sky market (7% on average).
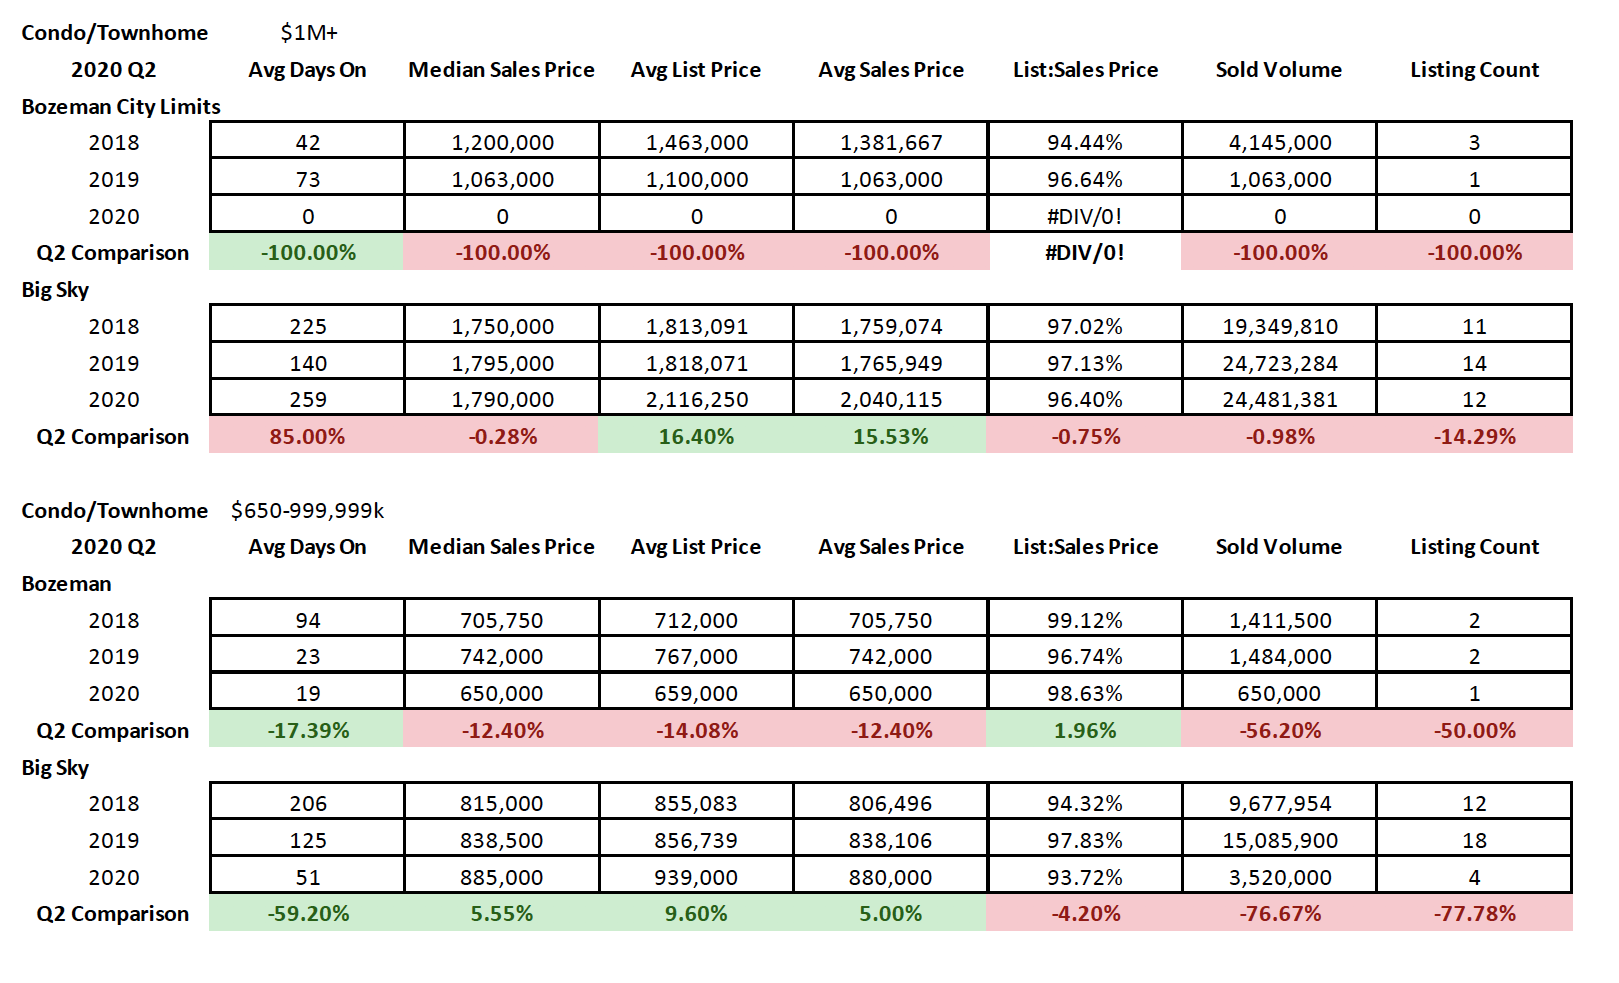
Luxury condos and townhomes – those close above $1M – saw a reduction in number sold (down 14% year over year), list to sales price ratios showed discounting of 3.5% on average, and days on market were up significantly. City of Bozeman posted no luxury condo or townhome sales during Q2 2020.