


The slow down in median sales price appreciation and the decrease of sold units that we began to feel late last spring (and that continued throughout the remainder of 2022 and 2023), has finally started to show up in our data. Quarter 1 2022 was the last quarter that we experienced the intense market pressure so common in the later half of 2020 and all of 2021 – resulting in a very competitive marketplace with low inventory, multiple offers, and an explosive trajectory of growth in sales price appreciation. Quarter 1 2023 is very much a ‘return to more normal’ conditions prior to the Covid boom.
Slightly fewer new listings have hit the market than last spring in our area – perhaps fueled by the harder winter conditions we experienced this year and hesitation about interest rates and inflation. Buyers are starting to get used to the new rate environment as the shock of the market becomes smaller in the rear view mirror. But there are less sales overall in the past quarter than in the past couple of years.
Because of the abnormality in number of transactions closed, market appreciation, and other factors evident over the past few years, we’ve gone back to 2020 to compare market dynamics with 2023. Q1 2020 was the last quarter before the market went haywire over the pandemic, and appears to be the most ‘close to normal’ data in market conditions for comparison. 2020 was not a hard winter, so there may have been some difference in buyer sentiment and excitement to that of this year, which was a hard winter with snow and cold temps (snow on the ground starting late fall 2022).
Single family
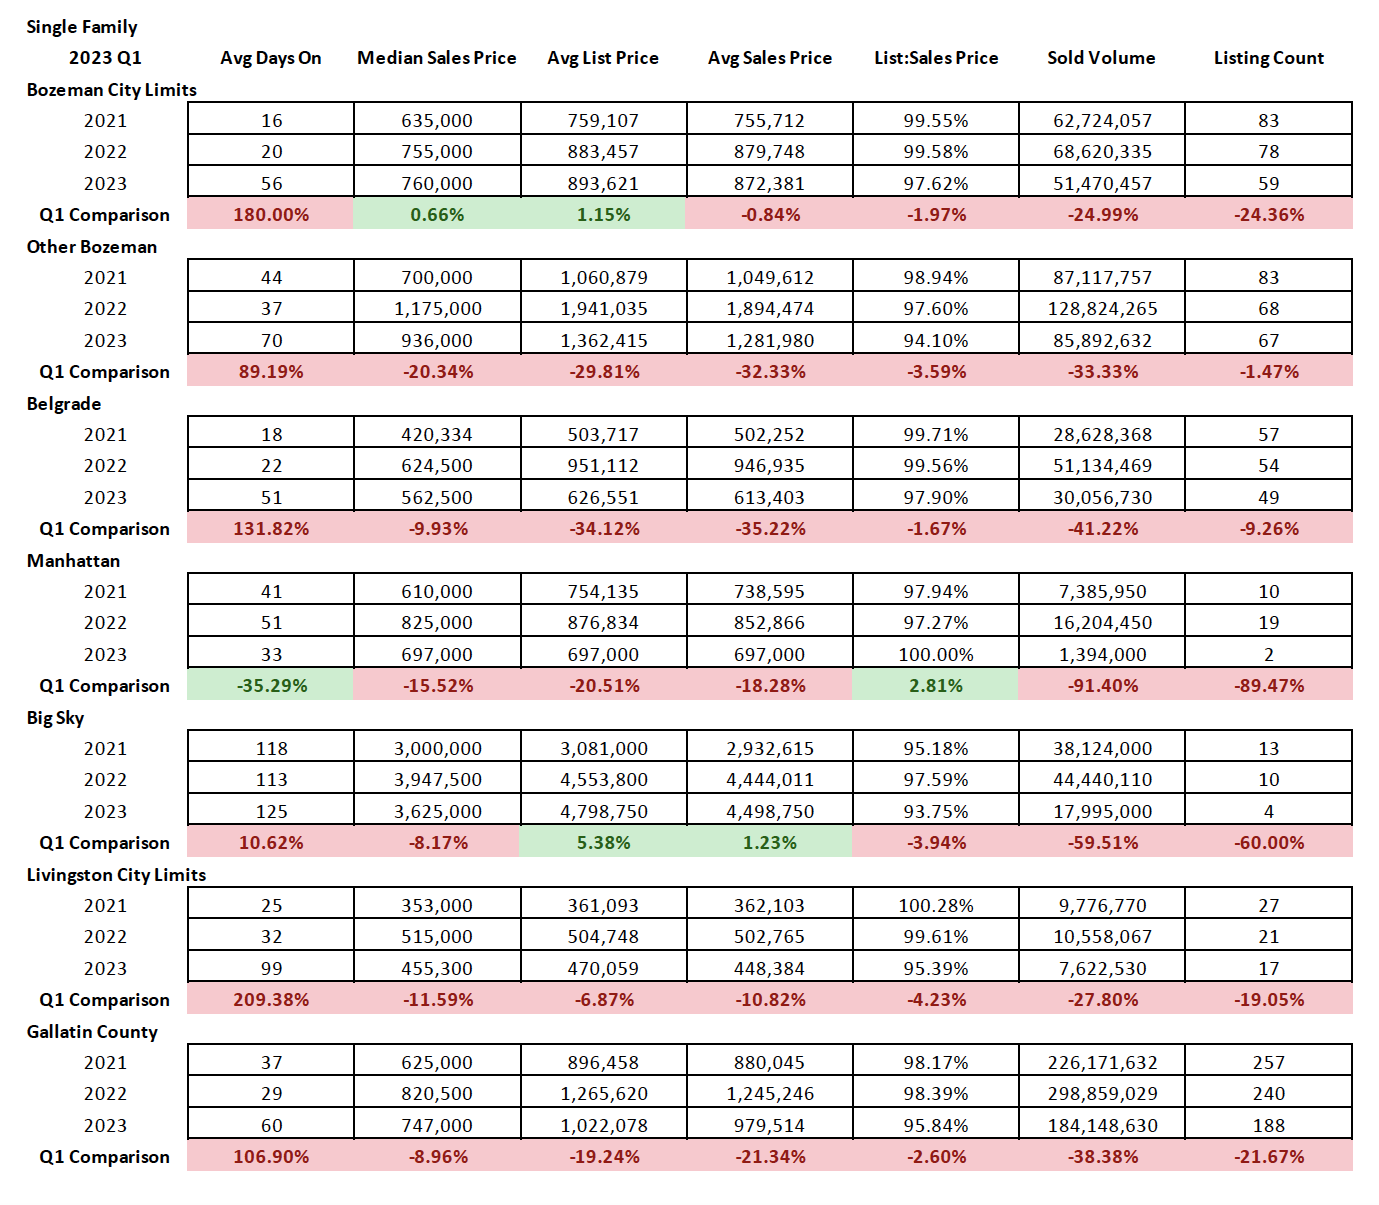
Single family home sales in Q1 2023 were across the board considerably slower than in Q1 2022 – days on market were up in all areas except Manhattan. Number of listings sold was down between 2-90% depending on area, with 25% in Bozeman, 2% in Bozeman surround, 9% in Belgrade, 90% in Manhattan, 60% in Big Sky, and 20% in Livingston. New listings on the market were off slightly between Q1 2022 and Q1 2023 – when combined with number of sold properties, there is a slight increase in inventory. Median sales price is off from Q1 2022, between 9-20% depending on area – with only City of Bozeman breaking even with flat appreciation. Some of the areas tracked had an influx of new construction last year that is now no longer hitting the market, which has skewed numbers slightly. List to sales price ratios show that buyers are negotiating with sellers at between 3-7% off current list price, depending on area. That is a bigger swing compared to last year when discount was closer to 1-2.5% off list price. Please note that there may be a difference between original list prices and final listing prices, which would indicate more discounting that is taking place than what is tracked here. Sold volume for Q1 2023 is lower by 25-60% from Q1 2022.
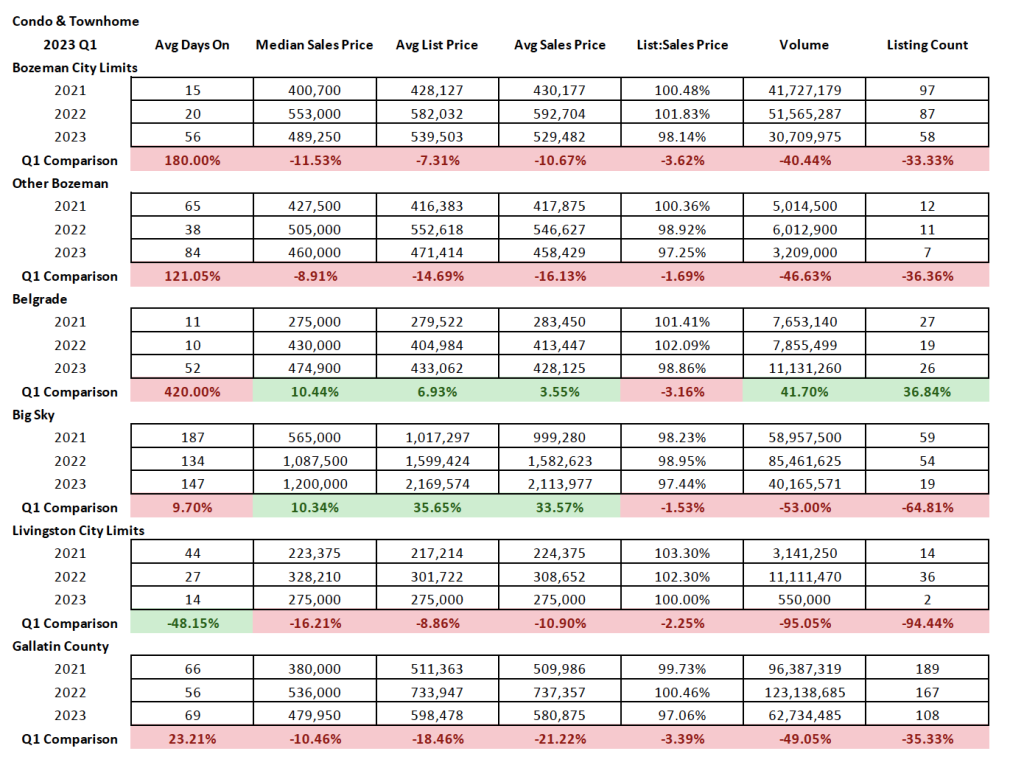
Condo and Townhomes

Condo and townhome sales were a mixed bag in Q1 2023 over Q1 2022. Being a ‘more affordable’ product in general, sales have been robust in this area of the market during the past few years – but the number of listings sold was off between 30-90% depending on area – with the exception of Belgrade which has a flurry of new construction options available. Livingston had a similar situation in 2022 so they dropped to very few condo/townhome sales as the new construction inventory disappeared. This can indicate that there is unfulfilled demand that remains for new construction product. Days on market have increased in all areas (with exception of Livingston, again skewed due to the new construction data from 2022) to an average of 60 days in City of Bozeman, 90 days in greater Bozeman, 60 days in Belgrade and close to 6 months in Big Sky. List to sales price ratios show discounting off list price between 2-3% on average – a change from the at or above list to sales price ratios of 2022. Sold volume is down in all areas by 40-95% – with the exception of Belgrade and the new construction product allowing for more concentrated closed sales.
Land
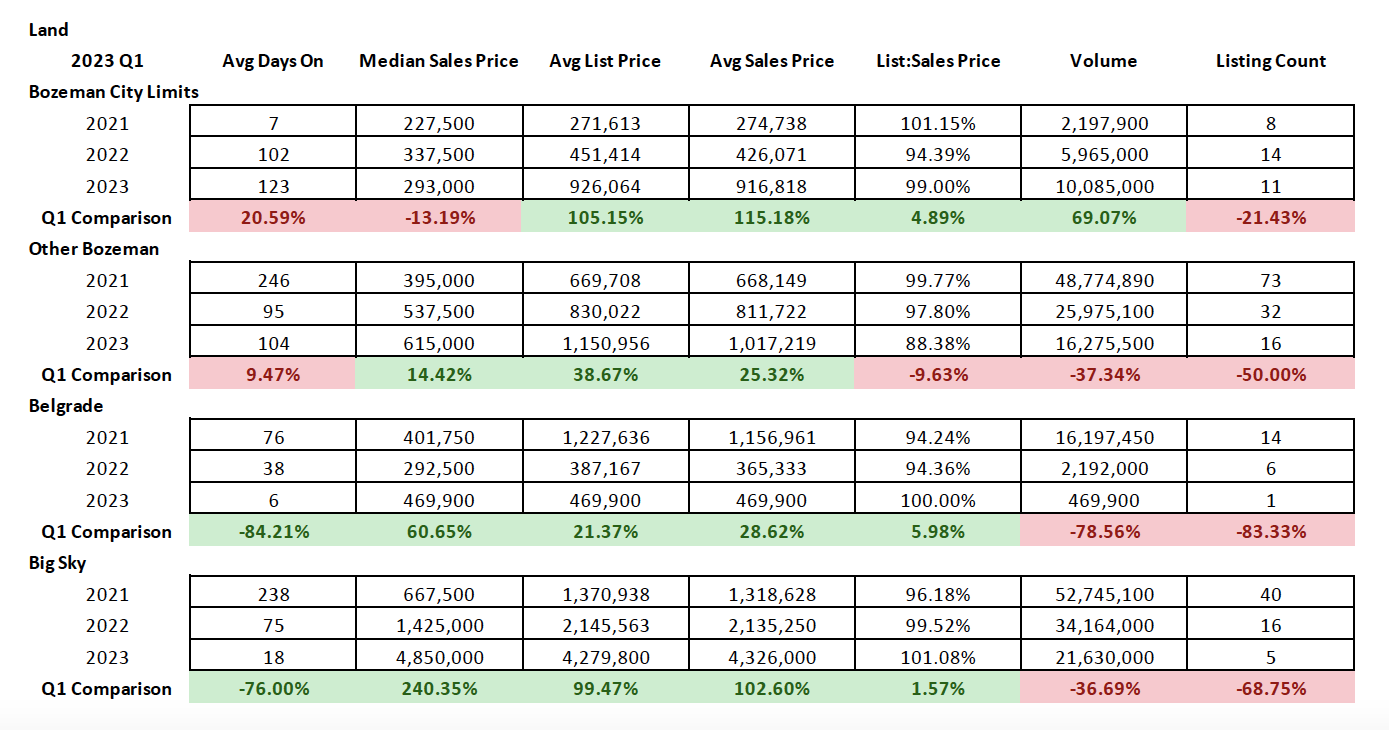
Land sales have continued to be pretty strong overall with median sales prices still climbing in greater Bozeman, Belgrade, and Big Sky, as buyers who haven’t been able to find the right product to purchase continue to buy land and build. With little inventory available, Belgrade only posted one sale during Q1 – down 83% from Q1 2022 when there were additional lots on market. City of Bozeman in Q1 2023 was off 20%, Greater Bozeman off 50% and Big Sky off 69% from number of sales posted in Q1 2022. Median sales prices were up 15% in greater Bozeman, 240 % in Big Sky, and down 14% in City of Bozeman. Sold volume was up in City of Bozeman – showing that lots sold were cheaper and perhaps not of like quality to product sold in Q1 2022. Sold volume was off in all other areas – declining 40% in greater Bozeman and 37% in Big Sky. List to sales price ratios showed that buyers were discounting less in City of Bozeman as inventory wanes and prices come down – 1% on average. Same for Greater Big Sky – with buyers actually paying above list price on average by 1%. Greater Bozeman is being discounted at 12% on average.
High End and Luxury
Single Family
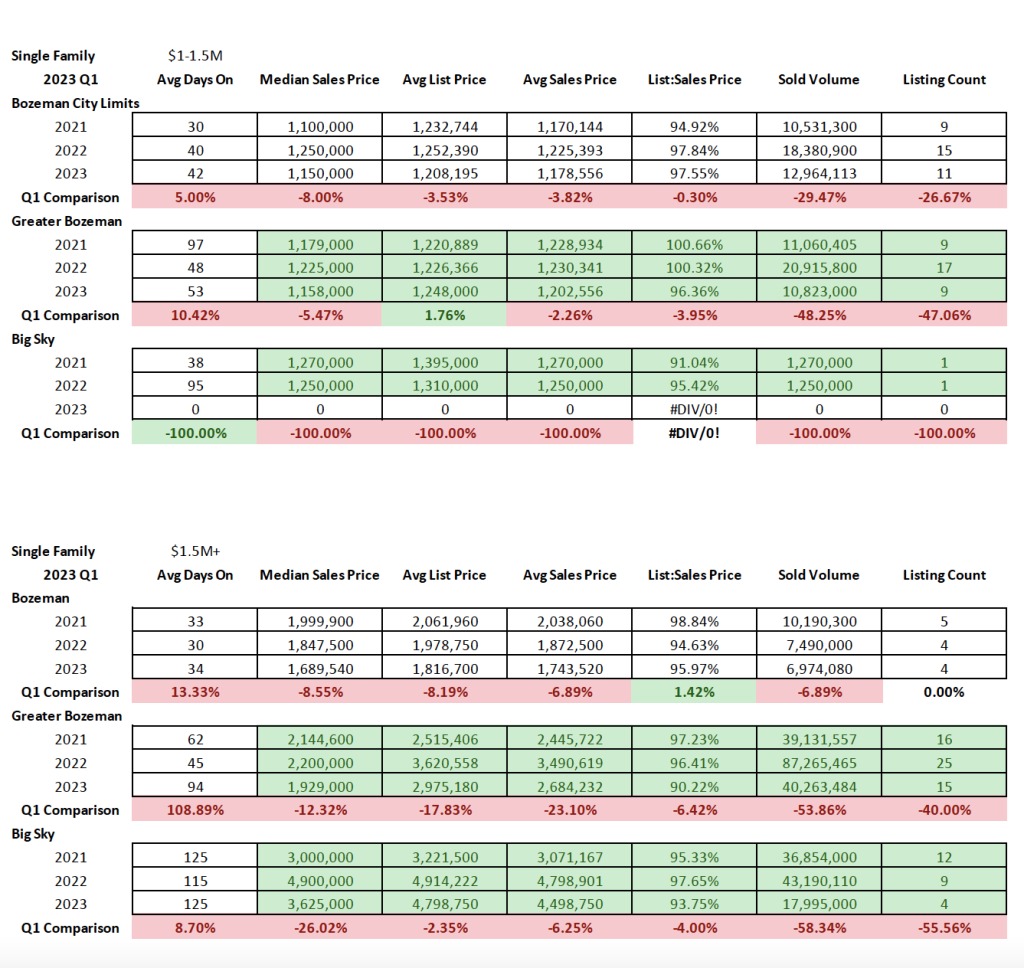
High-end single-family home sales – those between $1M-$1.5M in sold pricing, didn’t budge much between Q1 2022 and Q1 2023. Sales remain robust with higher sold listing count over 2021 but not over 2022 in all areas tracked (Bozeman, Greater Bozeman). Volume was off in City of Bozeman from 2022, but was above 2021 numbers. Days on market have increased slightly to about 1.5 months in City of Bozeman and 2 months in greater Bozeman.
Luxury home sales – those over $1.5M in sold pricing – have dropped in number sold – in line with trends for typical home sales. City of Bozeman was stable in number of properties sold in this price point – greater Bozeman was down 40% and Big Sky was off by 55%. Sold volume was off as a result – pretty much in line with those percentages. List to sales price ratios show that buyers are on average discounting between 6-10% off original list price – indicating a more balanced, less seller focused, market.
Condo and Townhome
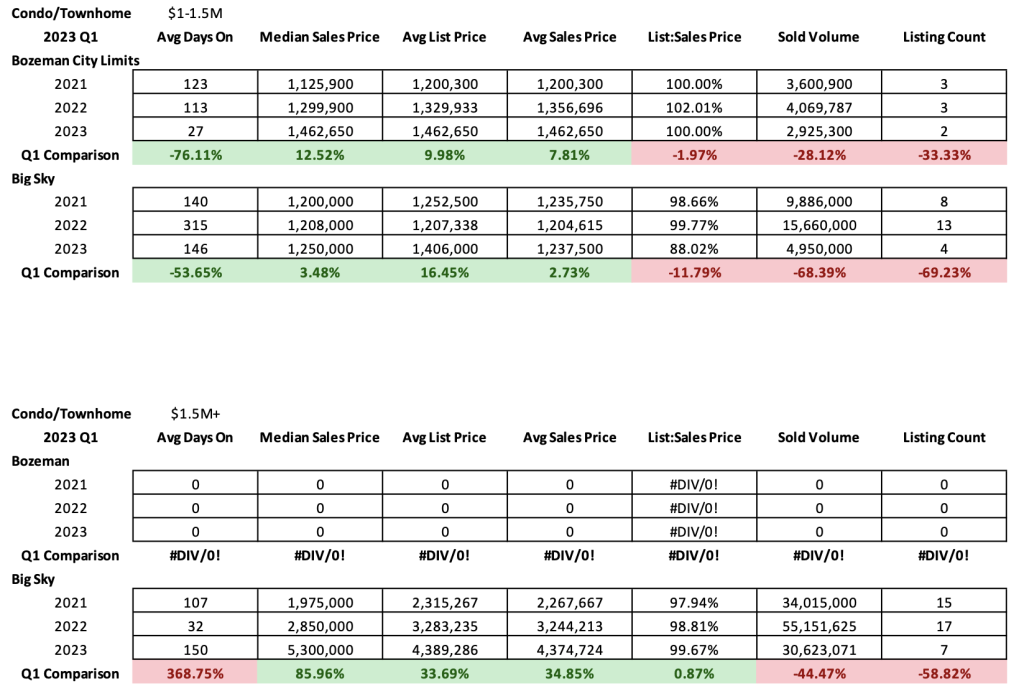
High-end condo and townhome sales (those between $1M-$1.5M in sold pricing) in the City of Bozeman had a significant drop in sold properties – off by 50% between Q1 2023 as compared with Q1 2022. List to sales price ratios showed very little discounting – less than 1% – indicating the scarcity of this sort of product in the City of Bozeman.
The number of luxury condo and townhome units sold (those over $1.5M in sold pricing) was fairly similar to 2021 and 2022 values in City of Bozeman. Big Sky was down by 70%. Days on market reduced for this product class in both Bozeman (down to under 1 month but only 2 sales were posted) and Big Sky (closer to half a year). List to sales price ratios show little to no discounting on sold price over list price in City of Bozeman (again only 2 sales) and about 12% discounting between sold price over list price in the Big Sky area.