


For a graphical chart version of this information, please visit our Market Stats page.
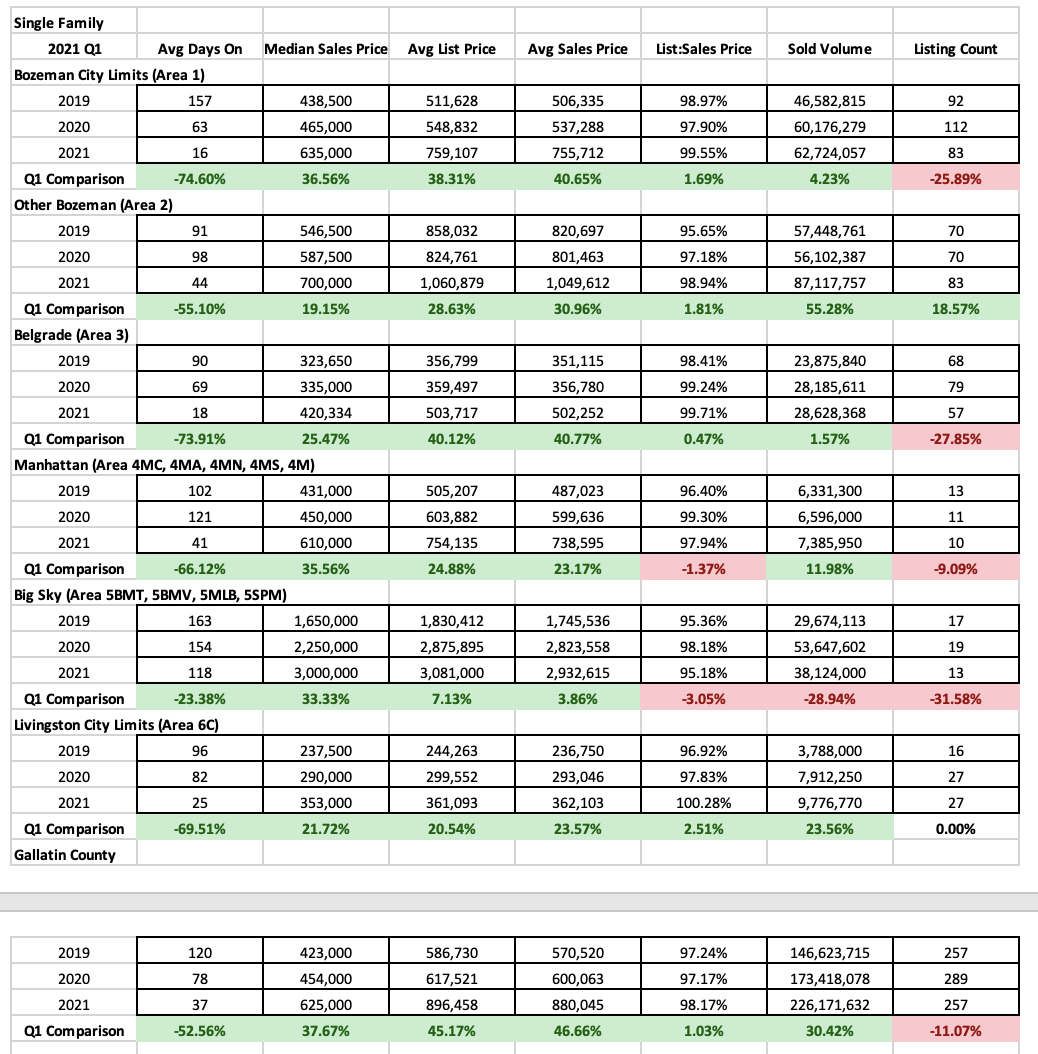
Single Family
Single family home sales were robust during Quarter 1 2021. In comparing this quarter to 2020, it is important to note that Q1 2020 was not yet considered ‘pandemic’ affected. 2020 had started off as one of the strongest quarters we’d seen to date – well above 2019 numbers for median sales price, number of listings sold and volume. 2021 has been record setting in all categories we track with exception of listing count. In almost all areas, our sold inventory has been reduced compared to both 2020 and 2019. On this note, 2020 actually had more properties sell than in prior years – bucking the overall media reported trend of ‘lack of inventory’. But with the increased buyer demand in our area not waning, we’ve worked though practically all of the ‘stale’ listings – giving very little depth to what is available on market for eager buyers at all price points.
We’re seeing double digit appreciation in all areas we track year over year. Median sales price in Bozeman is up 37% to $635,000, Greater Bozeman is up 19% to $700,000, Belgrade is up 25% to $420,000, Manhattan is up 36% to $610,000, Big Sky is up $33% to $3,000,000 and Livingston is up 22% to $353,000. Number of listings sold was down in all areas – 9-32% – with exception of greater Bozeman which was up 19%. List to sales price ratios – an indicator of how much discounting off list price that properties are closing at – is showings an extremely strong seller’s market in all areas. Some areas – Bozeman, Greater Bozeman and Livingston – are less than 1% discounting on average with some over 100% – meaning listings on average are selling for more than list. This will be interesting to track for Q2 as we’re seeing many multiple offer situations with closed prices extending 5% 10%, 15%, 20%, even 25% over asking in some circumstances.
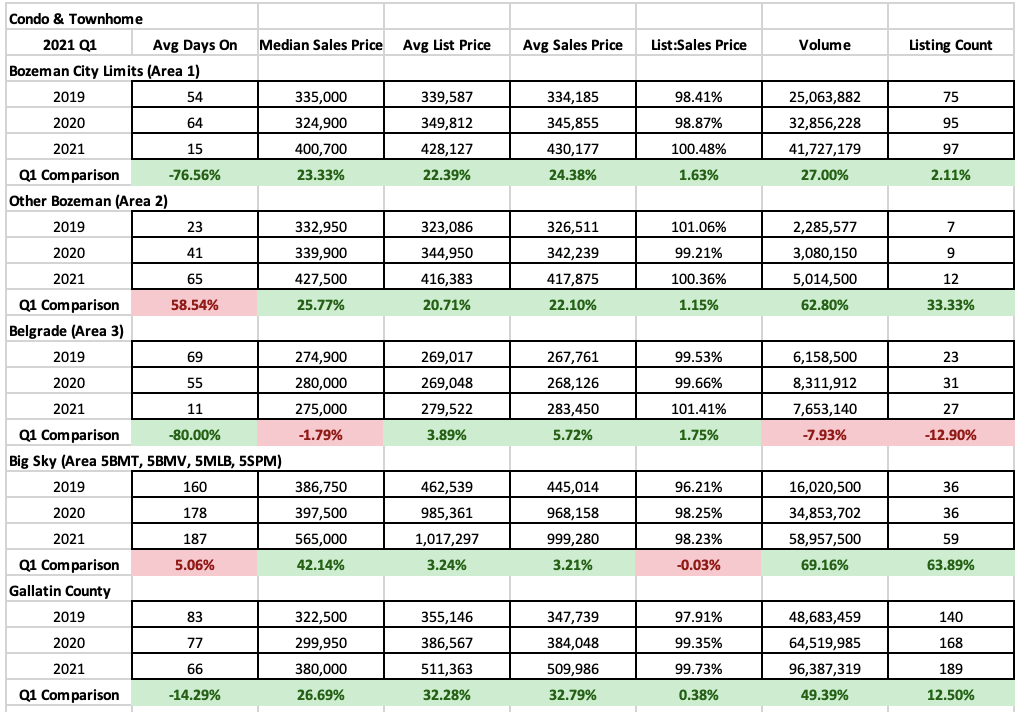
Condo & Townhomes
Condo and townhome sales were also highly active during Q1 2021 – with many buyers focusing on these products as more affordable options. Median sales price has jumped 20-40% in most areas with Belgrade’s pricing remaining flat. Bozeman saw a 24% jump to $401,000, Greater Bozeman saw a 26% jump to $428,000, Big Sky saw a 42% jump to $565,000 and Belgrade remained at $270,000. Number of listings sold was up in Bozeman, greater Bozeman and Big Sky but down in Belgrade (less new construction hitting market after some banner new construction years). List to sales price ratios show that properties were going above asking on average in Bozeman, Greater Bozeman and Belgrade with just a little discounting in Big Sky.
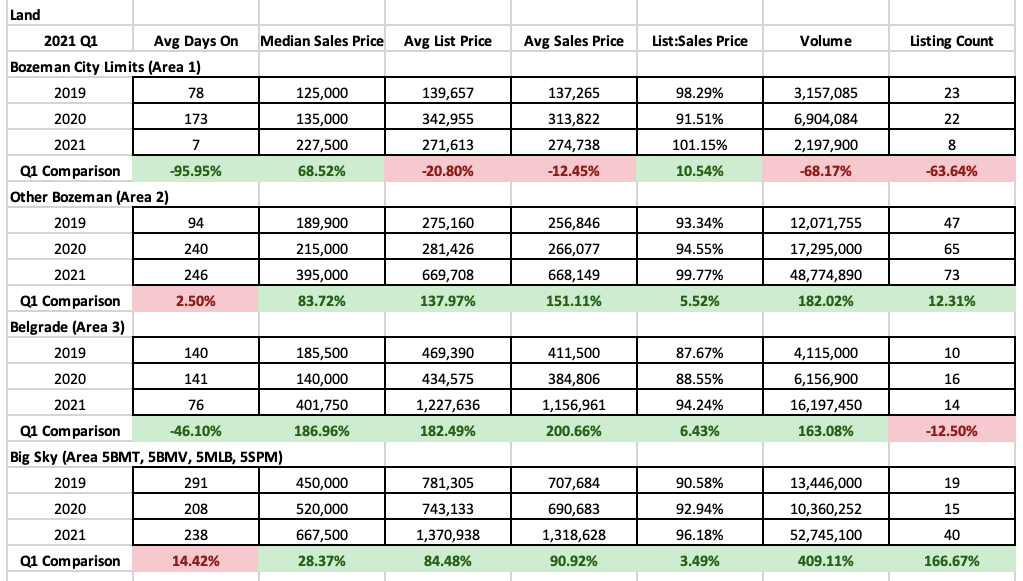
Land
Land sales took off in Q1 2021 – almost all available land, especially 1+ acre lots, were extremely desirable as buyers who were not able to find a good fit with available inventory. chose to build instead. Median sales price was up 69% in Bozeman to $227,500; up 84% in Greater Bozeman to $395,000; up 197% in Belgrade to $402,000; and up 28% in Big Sky to $667,500. Number of listings sold was mixed – greater Bozeman and Big Sky were up 13% and 167% respectively – City of Bozeman and Belgrade were both down as less inventory constrained the market. List to sales price ratios have improved dramatically – with lots sold in City of Bozeman closing on average above asking – greater Bozeman, Belgrade and Big Sky all narrowed into Seller’s market territory.
High End and Luxury
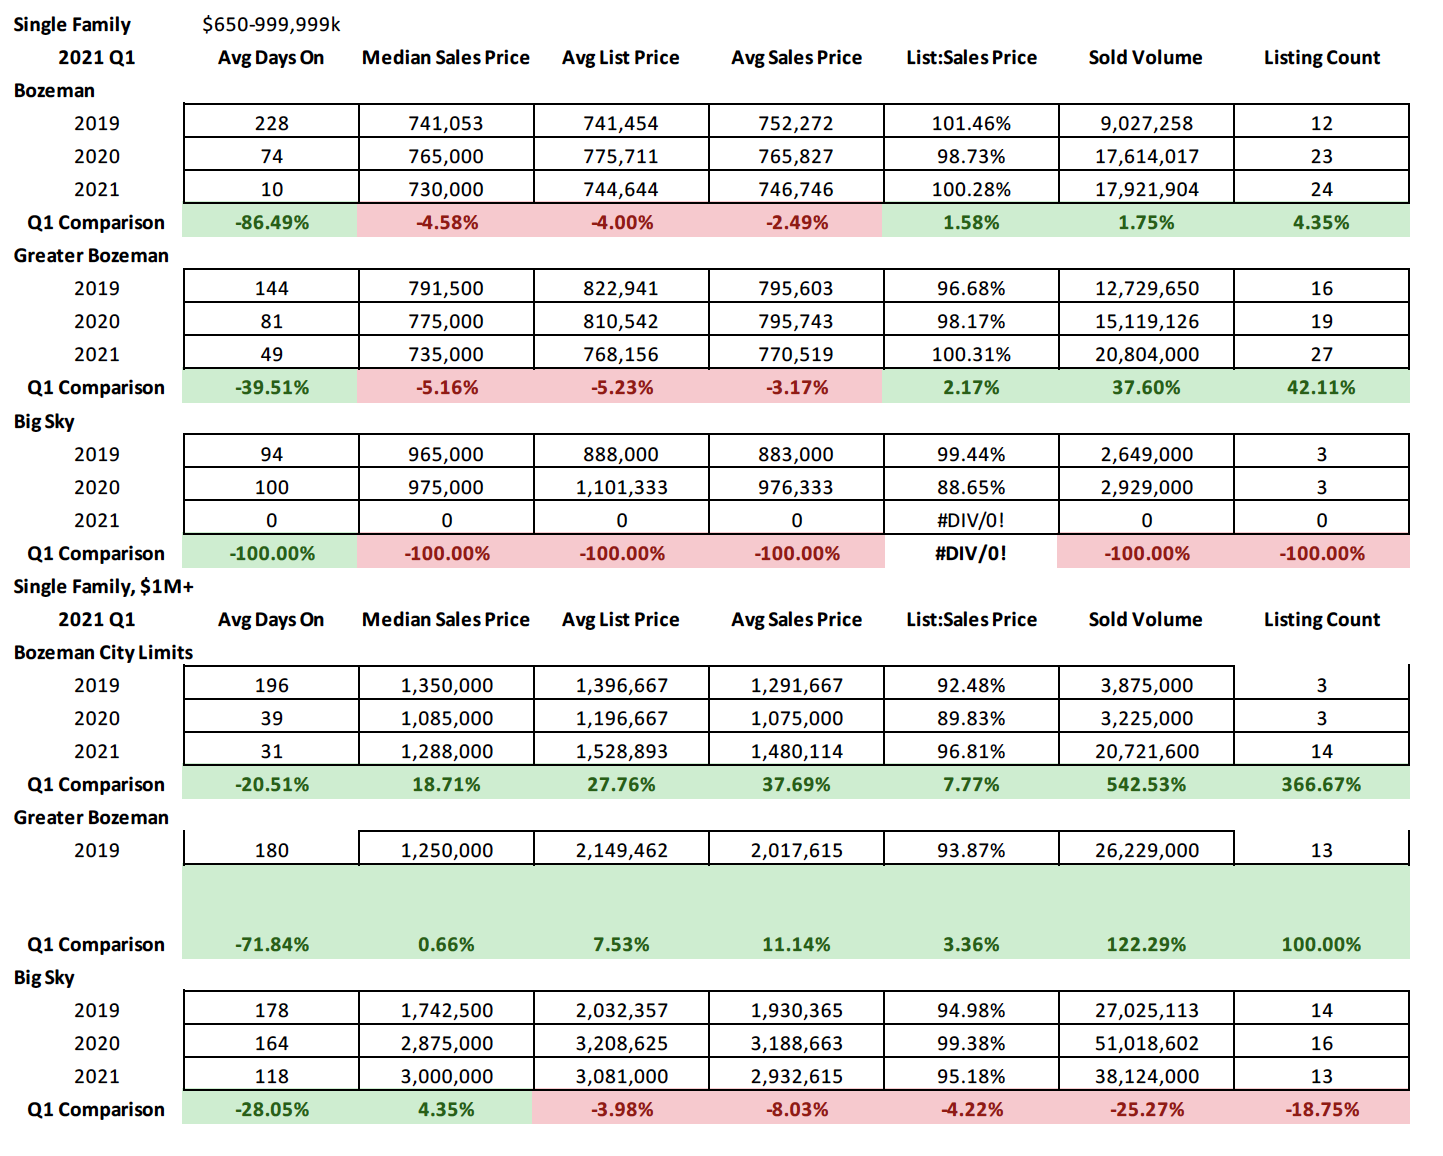
Single Family
*Due to volume constraints, we only track high end and luxury sales in City of Bozeman, Greater Bozeman and Big Sky
High end ($600,000-$999,999 priced homes) homes saw in Q1 2021 a jump in sold inventory year over year in Bozeman and Greater Bozeman – up 4% and 43% respectively and no activity in Big Sky as pricing in Big Sky has moved beyond pricing at $1M. Volume was up 2% in City of Bozeman and 38% in greater Bozeman. Most telling of where the market is at this price point is list to sales price ratio which is showing above list price on average sales with no buyer discounting.
Luxury ($1M+ priced homes) homes saw in Q1 2021 a huge jump in sold inventory in City of Bozeman and Greater Bozeman – up 367% in City of Bozeman and 100% in Greater Bozeman.- with a drop in sold inventory in Big Sky as available inventory has been very slim. Volume was up 540% in City of Bozeman and 123% in Greater Bozeman – while it was down 26% in Big Sky. List to sales price ratios show a strong seller’s market in all areas, with a significant narrowing of discounting happening in City of Bozeman and Greater Bozeman.
Condo & Townhome
*Due to volume constraints, we only track high end and luxury sales in City of Bozeman and Big Sky
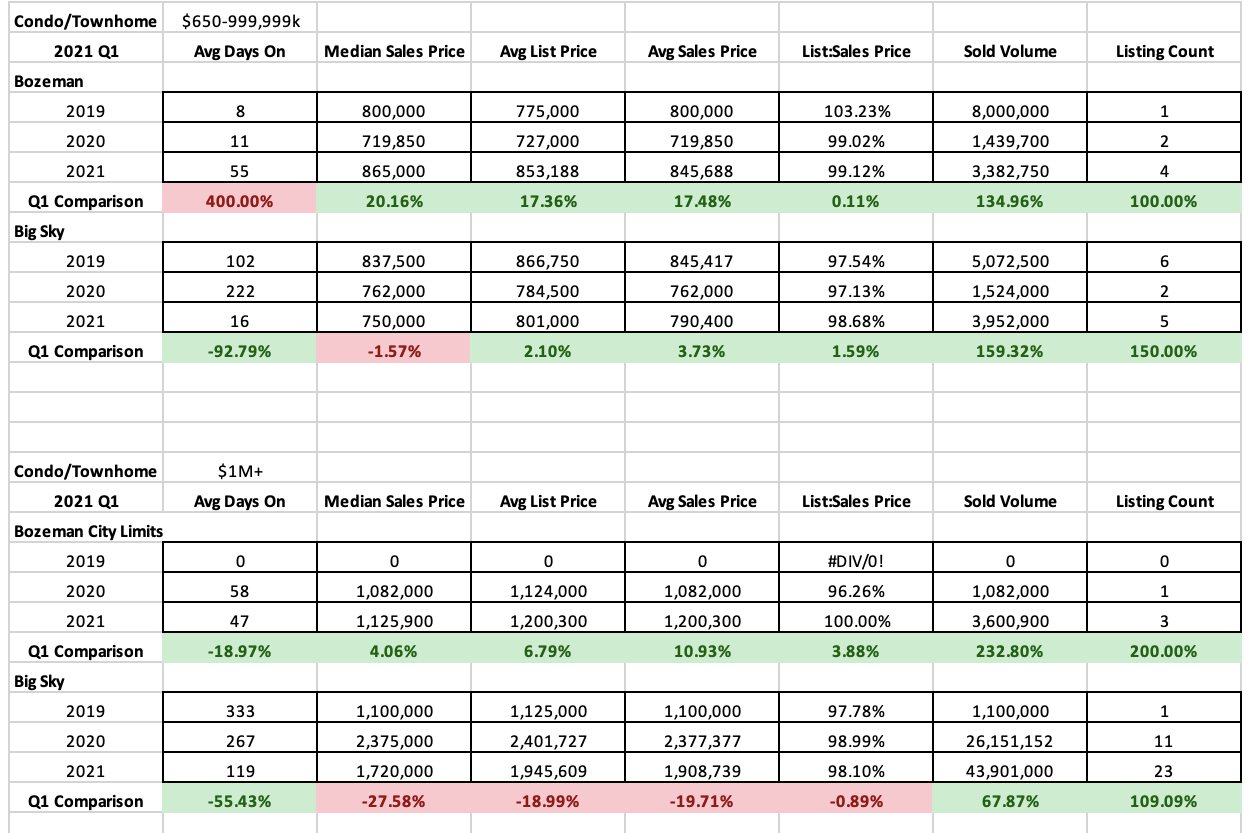
High end ($600,000-$999,999 priced condos and townhomes) in City of Bozeman saw a 100% jump year over year and a 150% jump year over year in Big Sky. Volume was up 145% in City of Bozeman and 160% in Big Sky. List to sales price ratios were both indicative of strong sellers markets, with very little discounting happening in either area.
Luxury ($1M+ priced condos and townhomes) in City of Bozeman saw a 200% jump year over year and 110% jump year over year in Big Sky. Volume was up in City of Bozeman 233% and 68% in Big Sky. List to sales price ratios shows a strong seller’s market with little discounting in Big Sky and no discounting in City of Bozeman.
Please contact us with questions or for more information – this is a statistical analysis for Q1 2021 and is a snapshot in time off BSCMLS as of April 12, 2021.