


Please enjoy our quarterly Southwest Montana real estate market analysis and breakdown of statistics for both Quarter 4 2018 and full year 2018 as compared with the previous two years.
One more really neat statistic – Knoff Group Real Estate’s broker, Marcie Hahn-Knoff, ranked in the top 25 real estate agents in the ENTIRE Big Sky MLS for volume of total sales for 2018. And in the top 15 for buyer side transactions volume. That’s out of over 900 agents!
Quarter 4 – 2018 Market Analysis
Single Family Homes
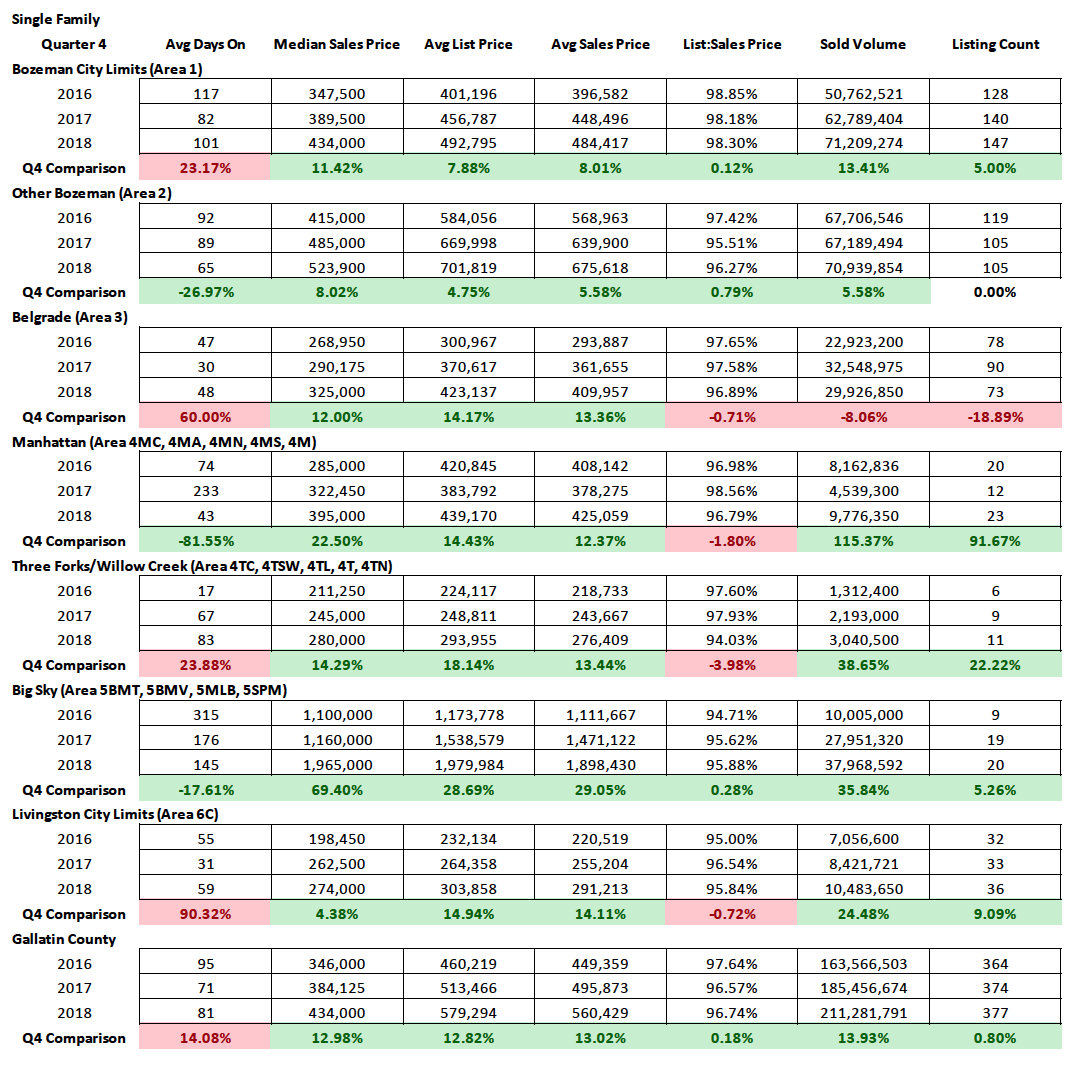
Median sales prices jumped significantly in all areas in Q4 with the exception of Livingston ($274kK) which hovered at 4%. City of Bozeman ($434K), Greater Bozeman ($524K), Belgrade ($325K) and Three Forks ($280) all hovered in the 8-14% range. Manhattan ($395K) was at 23% and Big Sky ($1.96M) shot up 70%.
Days on market were up significantly in several areas, including City of Bozeman (up to over 3 months), Belgrade (up to almost a month and a half), Three Forks (up to almost 3 months), and Livingston (up to just under 2 months). The amount of properties sold is also down in some of these areas as well. This may correspond to less affordable product being available or a softness due to high pricing and buyer fatigue.
List to sales price ratios show a more balanced market between buyers and sellers, with ratios sitting in the 96-98% range for the bulk of the market – discounting is happening.
Condos and Townhomes
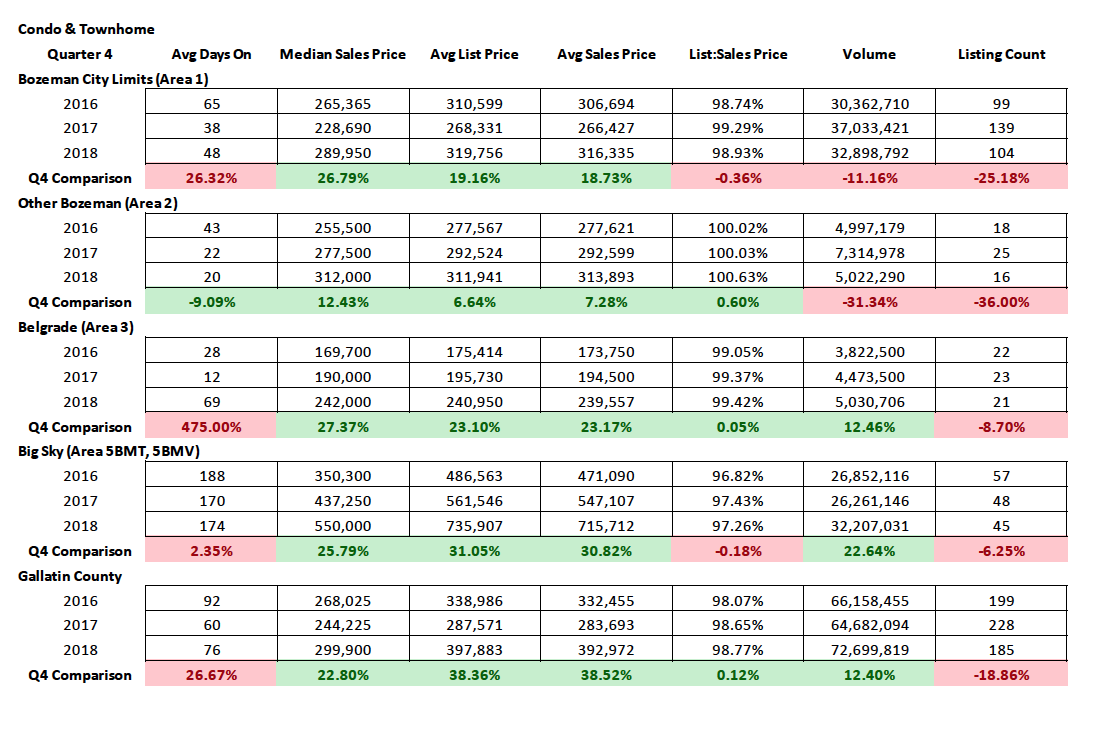
Median sales prices on condos have skyrocketed in all areas in Q4, ranging in appreciation from 12-27%. Greater Bozeman ($312,000) was at 12% . All three other areas tracked, City of Bozeman ($290K), Belgrade ($242K) and Big Sky ($550K) were between 26-27% year over year.
Days on market were up in all areas with the exception of Greater Bozeman. Belgrade’s numbers are skewed due to saturation of new townhome and condo options that were previously not available in that market.
Number of properties sold is down in all areas. This is interesting in that Quarter 4 experienced a softness at the bottom of the market from September-November. It seems a combination of rising interest rates along with pricing fatigue and uncertainty played an influential role. This softness has backed off as of December.
List to sales price ratios do show a strong seller’s market in the City of Bozeman, Greater Bozeman and Belgrade areas and a more balanced market in the Big Sky market.
Land
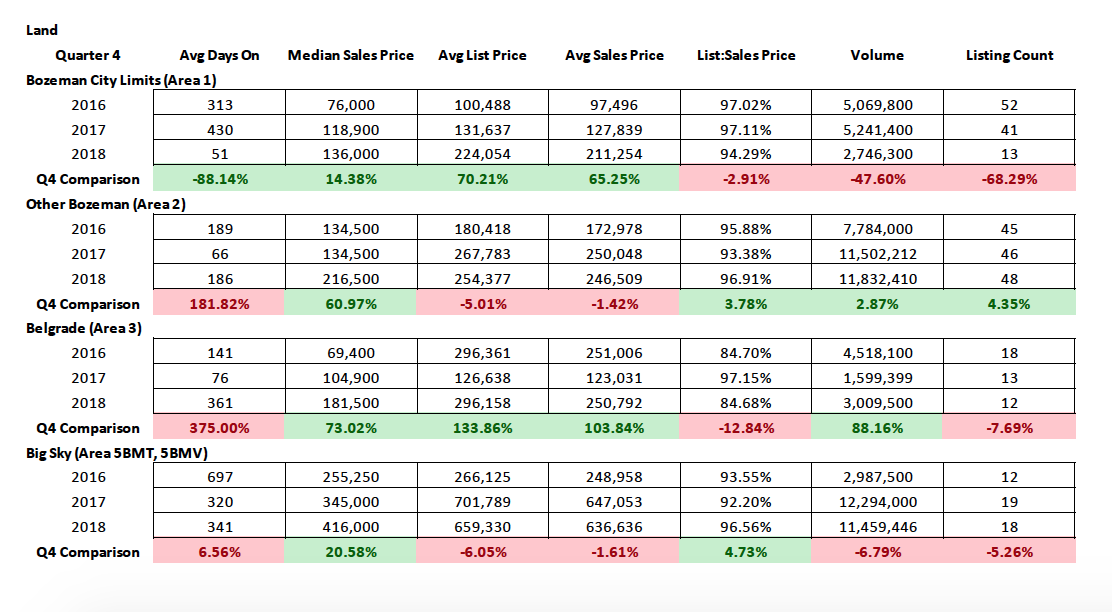
Median sales prices have jumped in all areas tracked, ranging from 14% in City of Bozeman ($136K) to 21% in Big Sky ($416K) to a remarkable 61% in Greater Bozeman ($216,500) and 73% in Belgrade ($181,500).
Days on market are up in all areas with exception of the City of Bozeman – likely due to properties with long listing times finally moving off the market.
2018 Full Year Market Analysis
Single Family Homes
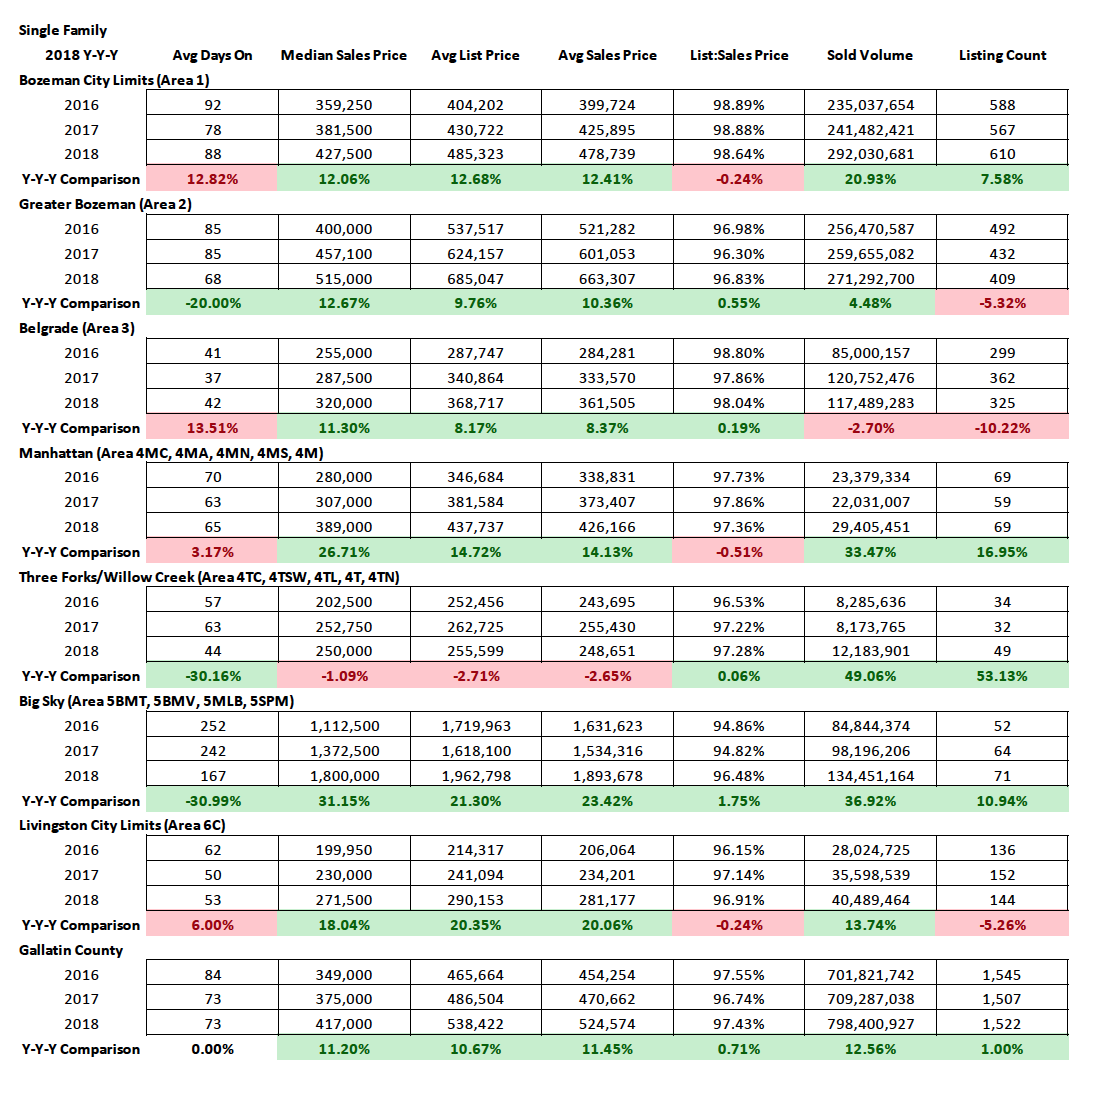
Median sales price has increased in all areas with the exception of Three Forks ($250K) which has stayed steady. Bozeman ($428K), Bozeman Area ($515K) and Belgrade ($320K) sat at 11-12% appreciation respectively. Highest jumps were in Big Sky (31% at $1.8M), Manhattan (26% at $389K) and Livingston (18% at $272K).
Average days on market has increased or stayed relatively constant in many areas with the exception of Big Sky where it dropped 31% to just over 5 months. Bozeman is at just under 3 months, Greater Bozeman is at just over 2 months and Belgrade and Livingston are just over 1 month.
Number of listings sold jumped slightly in Bozeman, jumped significantly in Manhattan, Three Forks, and Big Sky and has fallen in Livingston, Greater Bozeman and Belgrade.
Average list to sale price ratios increased steadily – between 20-40%, in all areas with the exception of Greater Bozeman and Belgrade markets which stayed constant with the year prior. All markets are above 96% list to sale price ratio – with most areas in the 97-98% realm. Indicative of an accelerating market, still favoring sellers but finding balance in some areas with buyers as well.
Condo and Townhomes
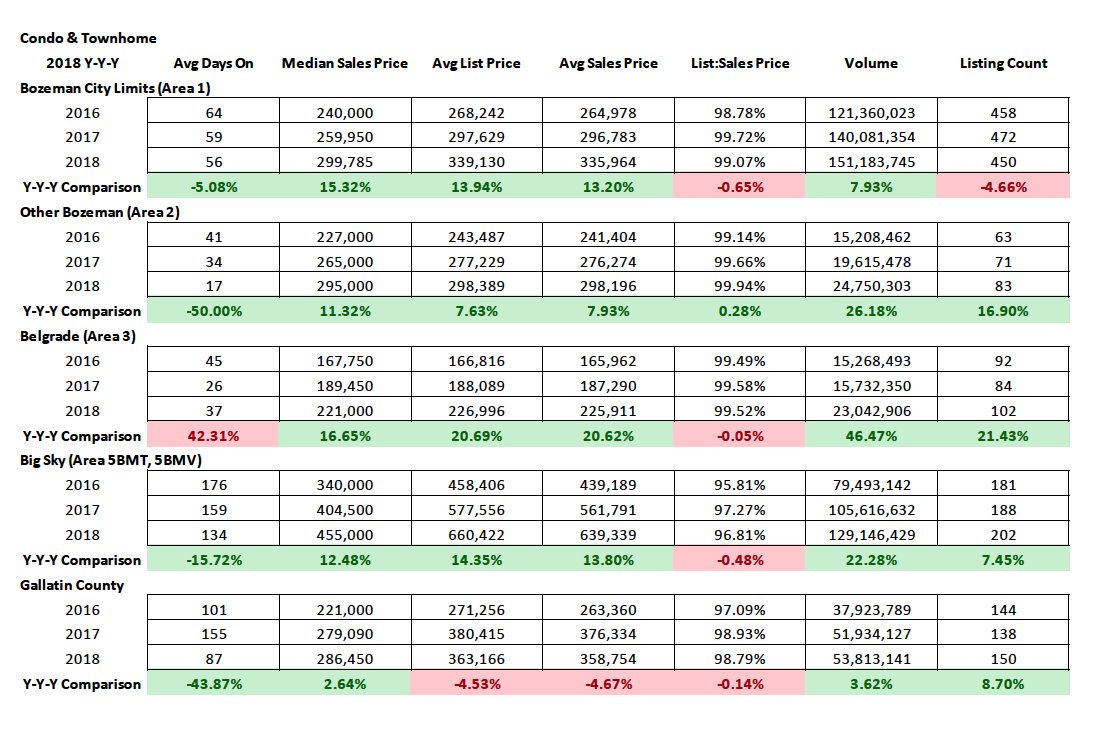
Medians sales rose in all areas with significant rises from 12-17%. Belgrade ($221K) ranked highest at almost 17%, followed by Bozeman ($300K) at 15%, Big Sky ($455K) at 12.5% and Greater Bozeman ($295K) at 11%.
Average Days on market were down in all areas with the exception of Belgrade – most significantly in the Greater Bozeman area where they are less than 3 weeks.
Number of listings sold were up significantly in all areas, between 7.5-21.5%, with the exception of City of Bozeman which fell off slightly This drop is likely tied to lack of affordable inventory.
Average list to sale price ratios show a strong seller’s market in all areas with above 99% on average, with the exception of Big Sky (97%). Big Sky still finds a more balanced market that allows for negotiation once out of the most affordable product available.
Land

Land pricing has shot up due to lack of quality supply and greater competition in the past year. Median Sales prices jumped 44% in City of Bozeman ($127K), 38% in Greater Bozeman ($199K), 70% in Belgrade ($145K) and 34% in Big Sky ($338K).
Days on market have climbed In the Belgrade and Big Sky areas – partially due to lots that have sat on the market for a longer time finally selling. And lots in new development neighborhoods in Belgrade that have taken a while to all sell.
Number of listings sold in all markets is down as inventory has been gobbled up. Number of listings sold in City of Bozeman were slashed by over 50% as inventory became unavailable.
List to sales price ratios shows a fairly balanced market between buyers and sellers, with ratios ranging from 94-97%.