The real estate market in the greater Bozeman, Big Sky, Belgrade and Livingston areas remained active in Q4 2024 year over year – though inventory has continued to build across all most areas.
Single Family
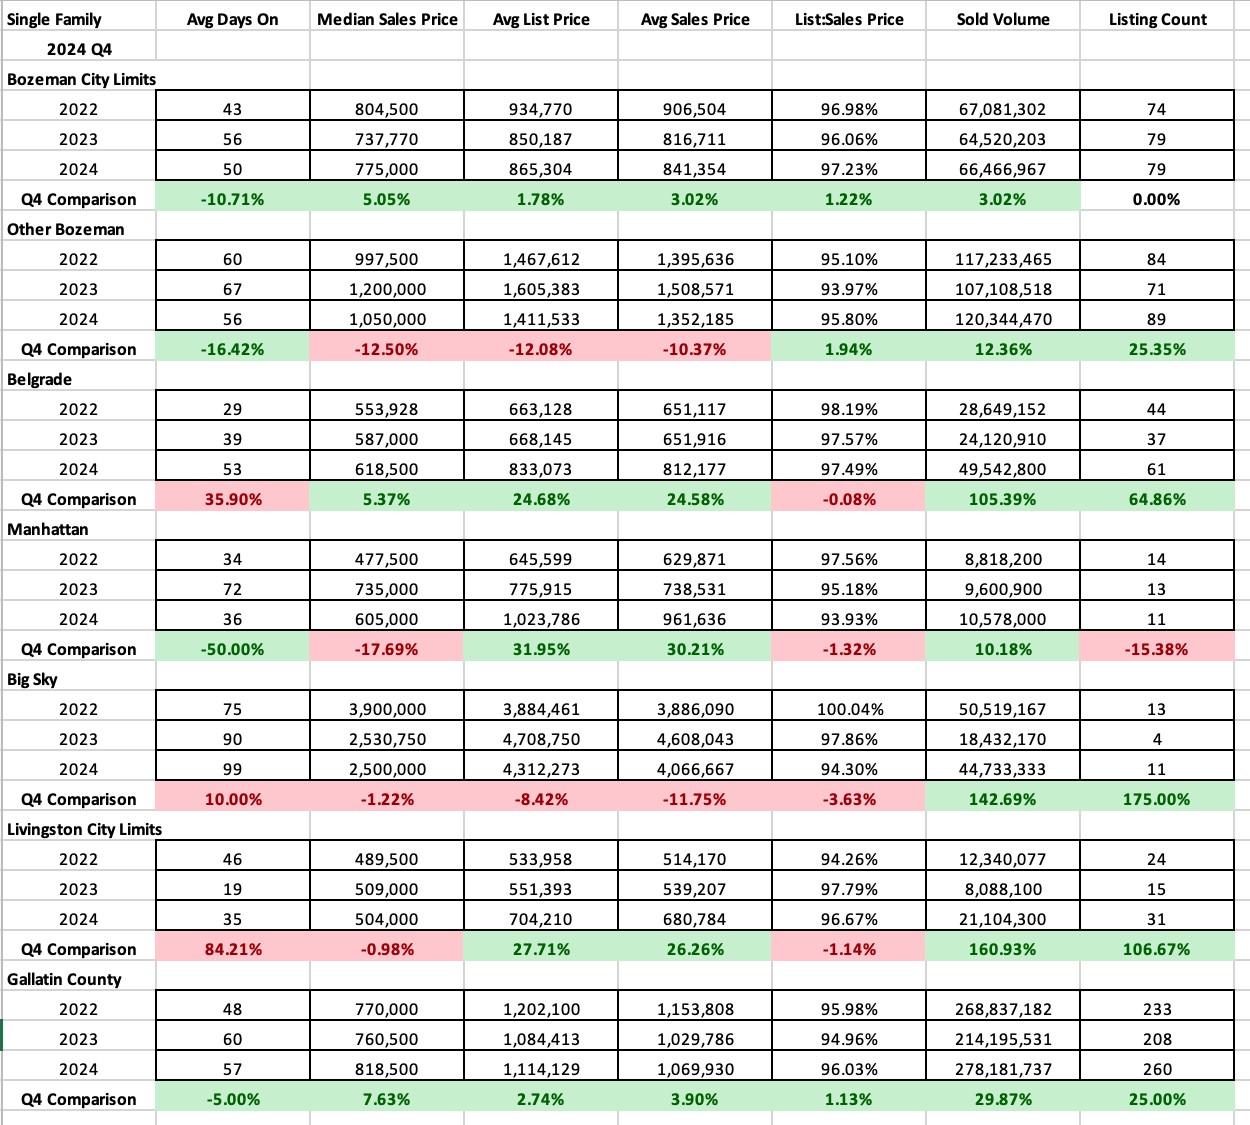
Single family home median sale prices stayed relatively flat throughout the area in Q4 2024, with pricing overall keeping within range of pricing in 2023 and 2022. Value stayed relatively constant. Median sales price for City of Bozeman ($775,000) and Belgrade ($618,500) were up slightly over Q4 2023. Median sales price for Greater Bozeman ($1,050,000), Manhattan ($605,000) and Livingston ($504,000) were all within range of values for 2022-2023 – relatively flat overall. Big Sky’s median price ($2,500,000) was down just slightly from 2023 and down more significantly from 2022.
Single family number of units sold were up in all areas for Q4 2024 over Q4 2023 with the exception of City of Bozeman and Manhattan which were flat. Number of units sold was up 25% in greater Bozeman, 65% in Belgrade, 175% in Big Sky, 106% in Livingston. Some of this can be attributed to new inventory in these areas, and some on sellers and buyers finally coming to terms on contracts on aging inventory.
List to sales price ratios in Q4 2024 show some discounting in all areas of the market – 2.75% on average in City of Bozeman, 4.2% in greater Bozeman, 2.5% on average in Belgrade, 6% on average in Manhattan, 5.7% on average in Big Sky, 3.4% on average in Livingston. These discounts are indicative of a more balanced market leaning towards more of a buyer’s market in some areas. Discounting has been influenced by a combination of forces, from market and political uncertainty to interest rates and speculation on direction of interest rates as well as overpricing of properties – still influenced by the previous pricing momentum from the pandemic that has now subsided.
Average days on market have been more volatile based on location. City of Bozeman days on market have come down to just under 2 months, City of Belgrade has risen to just under 2 months, Manhattan has dropped to just over a month, Big Sky has crept up slightly to over 3 months, Livingston has risen to just over a month.
Condo/Townhome
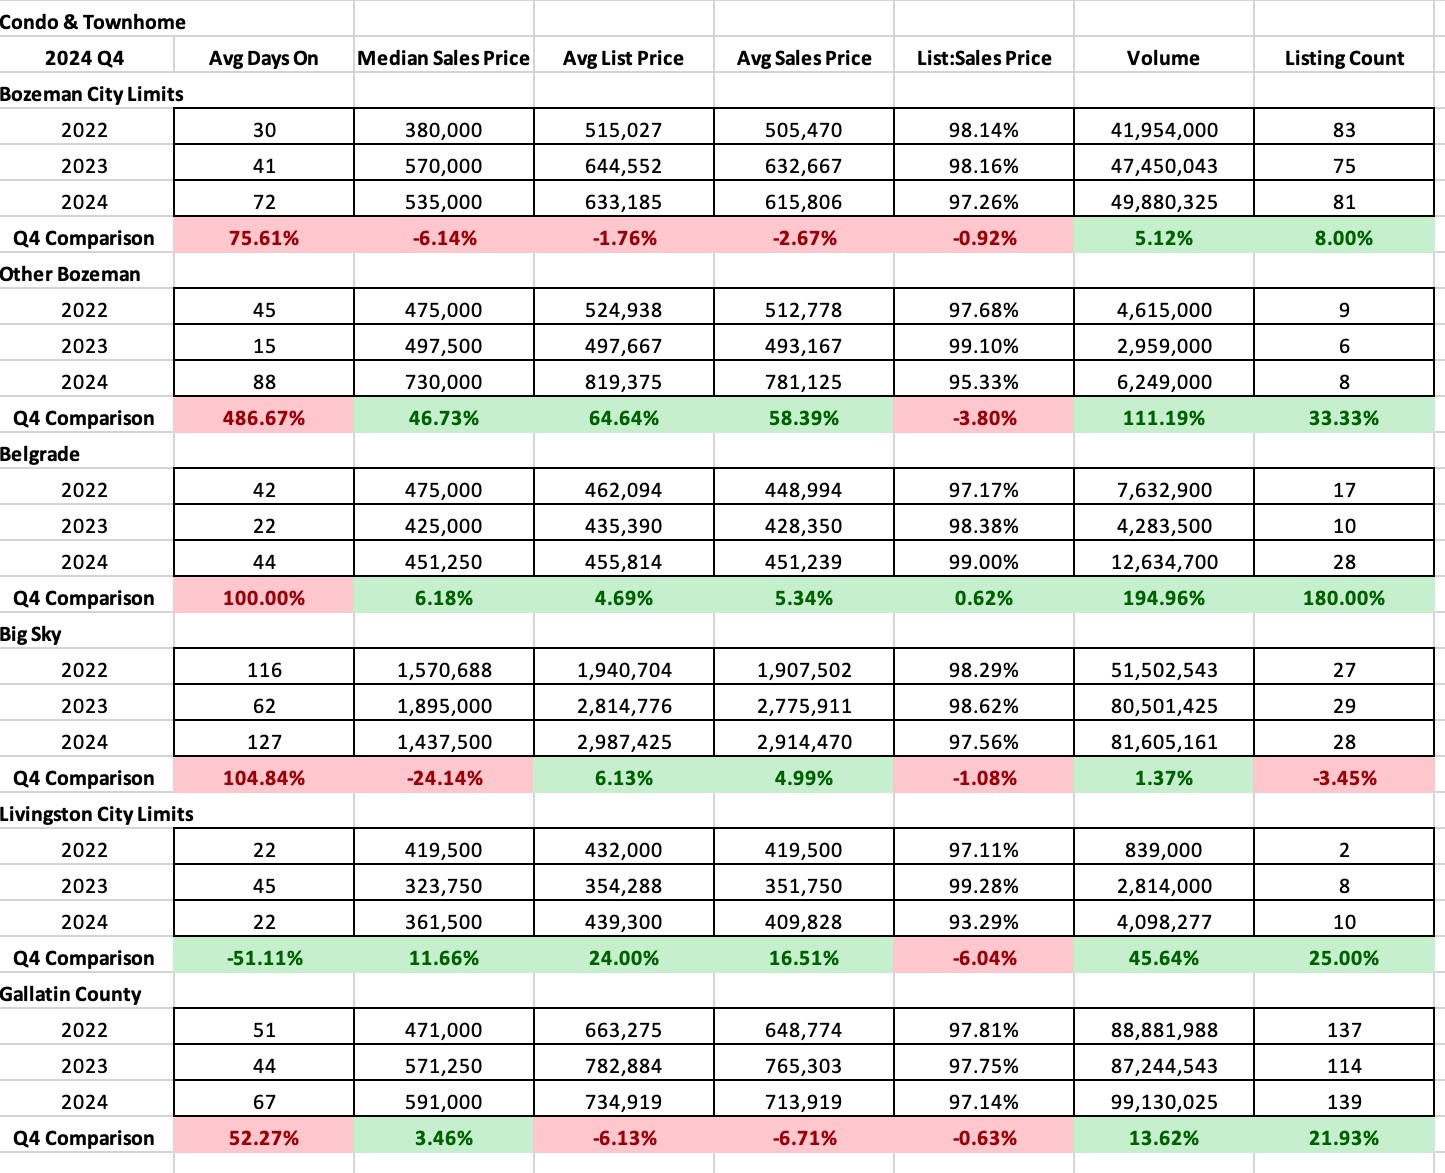
Condo and townhome median sales prices have been more dynamic area to area in Q4 2024. Median sales price in City of Bozeman ($535,000) was relatively flat. Greater Bozeman ($730,000) saw a big jump of 46%. Belgrade ($451,000) was relatively flat. Big Sky ($1,437,500) dropped 25% but 2023 may have been more of an anomaly with sales of new construction properties closing that pended during the pandemic. Livingston ($361,500) rose with the introduction of new construction inventory.
Condo and townhome number of units sold were relatively flat in all areas with the exception of Belgrade which almost tripled in number of properties sold – again due to the introduction of new construction inventory.
List to sales price ratios show more discounting than we’ve seen in the past few quarters – indicative of a more balanced condo and townhome market – during Q4 2024. Average discounting in Bozeman was 2.75%, Greater Bozeman 4.7%, Belgrade 1%, Big Sky 2.5%, Livingston 6.7%. Average days on market for condos and townhomes have been increasing in all areas steadily with the exception of Livingston. Average days on market for City of Bozeman are now 2.5 months, greater Bozeman 3 months, Belgrade 1.5 months, Big Sky 4 months, and Livingston 3 weeks.
Land
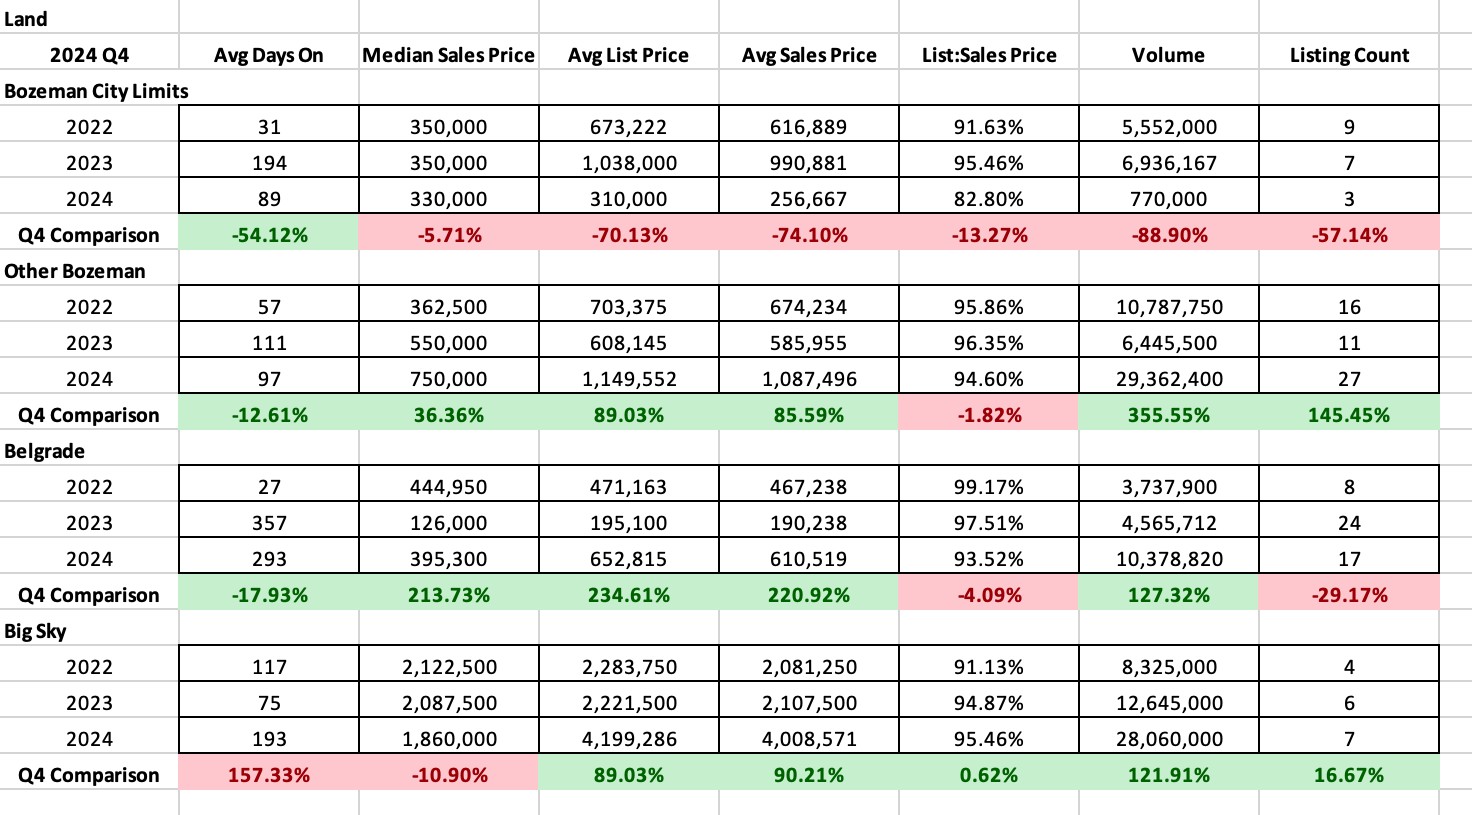
Median sales price for land has been stubborn to drop – indicative of a market that isn’t as highly influenced by interest rates and sellers that don’t need to sell quickly. But land has had a reduction of buyer activity overall. Median prices for City of Bozeman ($330,000) and Big Sky ($1,860,000) were slightly reduced but overall did not move much. Surprisingly, greater Bozeman ($750,000) jumped 36% with the sales of some new development lots that were luxury level and Belgrade ($395,300) has surpassed Bozeman for lot pricing with more multi-family lot options available and has essentially run out of less expensive lot options offered by new developments in 2023 – pricing has returned to closer to 2022 levels than 2023 levels.
Number of lots sold were down significantly in City of Bozeman and Belgrade but boosted in greater Bozeman and Big Sky partially due to new development options.
List to sales price ratios show discounting in all areas with severe discounting in the City of Bozeman (18%) indicating a strong buyer’s market, and more moderate discounting in greater Bozeman (5.4%), Belgrade (6.5%) and Big Sky (3.5%).
Average days on market have decreased in almost all areas with the exception of Big Sky which is now at just over 6 months on average. City of Bozeman is at almost 3 months, greater Bozeman is at 3 months and Belgrade is at just under 10 months.
High-End and Luxury
Single Family
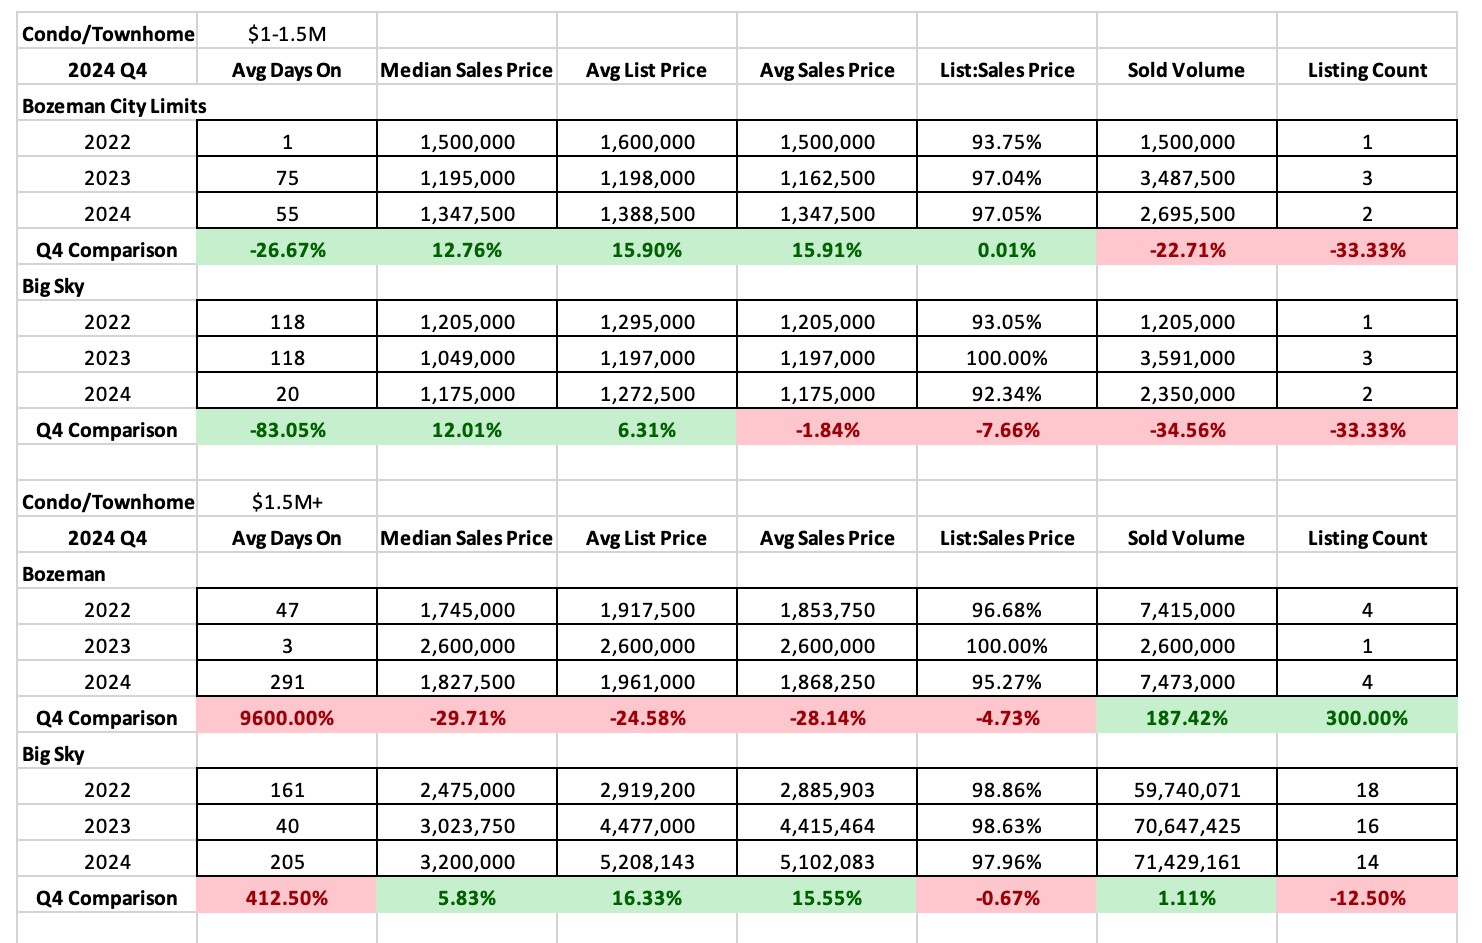
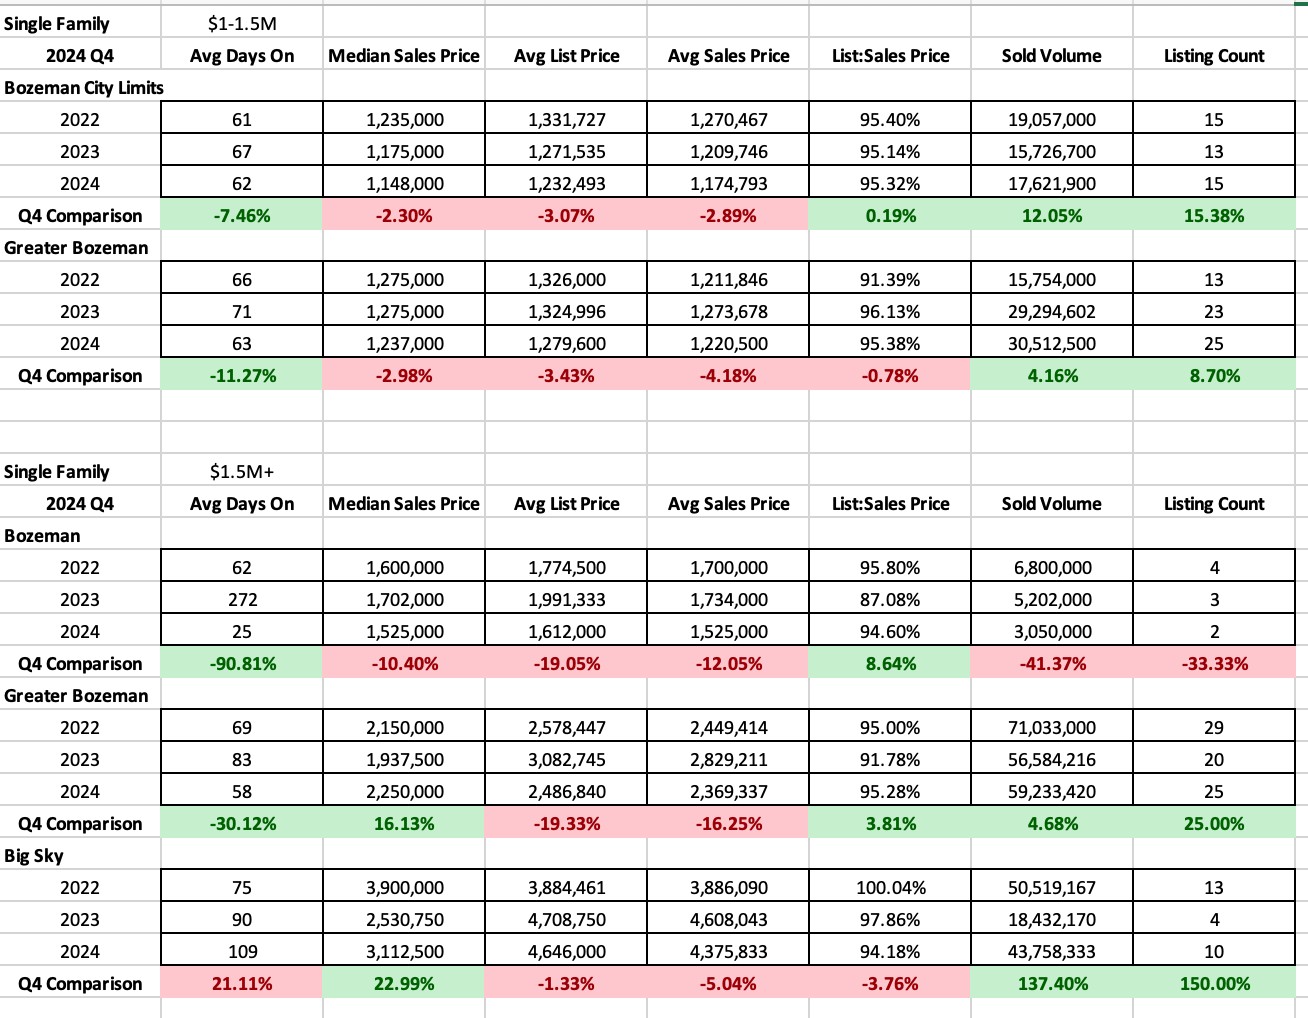
High-end single-family home number of sold listings (those $1M-$1.5M in closed price) in the two areas tracked (City of Bozeman, greater Bozeman) showed continued strong activity for number of units sold – City of Bozeman was essentially flat. Greater Bozeman has a spike of activity – increasing 75% over 2023 and 2022. List to sales price ratios show that there has been some discounting in both of these areas – but not drastic – it’s more indicative of a balanced market. Prices in City of Bozeman have been discounted 4.85% on average and greater Bozeman have been discounted 3.8% on average.
Luxury single family home number of sold listings (those $1.5M and higher in closed price) in the three areas tracked (City of Bozeman, greater Bozeman and Big Sky) were about on par in the City of Bozeman with Q4 2023, dropped in greater Bozeman (down 30%) significantly in Big Sky (down 70%). List to sales price ratios show increased discounting in all three areas – on average City of Bozeman luxury is being discounted 13%, greater Bozeman is being discounted 9.2% and Big Sky is being discounted 2.3%.
Condo/Townhomes
High-end condo and townhome number of sold listings (those $1M-$1.5M in closed price) in the two areas tracked (City of Bozeman and Big Sky) were relatively flat in the City of Bozeman and dropped significantly in Big Sky (down 70%). List to sales price ratios show very little discounting overall, but greater discounting than in 2023. City of Bozeman average discounting is at 1.1% and Big Sky is at 3.4%.
Luxury condo and townhome number of sold listings (those $1.5M and higher in closed price) were flat in the City of Bozeman and jumped in Big Sky due to delivery of new construction product (up 30%). List to sales price ratios show very little discounting of condo and townhome product – overall very little difference between 2023 and 2024. Average discounting in City of Bozeman was 0.4% and in Big Sky it was 1.3%. Partially influenced by the new construction nature of many condos being offered in the luxury market.
