To view in depth graphs please visit the Market Statistics Page.
It seems that every news outlet is currently reporting on the fact that interest rates for home loanshave gone up. And with a rise in interest rates the real estate market has slowed. But exactly how has it slowed?
Let’s dive in a bit deeper. So far in our analytics point out that the core appreciation experienced during the 2020-2021 ‘Covid’ years has not eroded. 2022 started off with a big bang in appreciation and that has been eaten into but pricing hasn’t dropped much off of where we were at the start of the year. Also, as a side note, many people in our market aren’t using conventional financing to purchase – it’s a great time to be a non-traditional buyer!
Also number of units sold is off of previous years, in some areas more than others, but not drastically and properties are still moving.
Days on market have risen some – but not as high as where they were before the pandemic. Properties with few exceptions are no longer selling in a day. Average days on market is sitting around three weeks to two months depending on what kind of product is being sold.
So why does it feel like the market has slowed or changed so noticeably – we have clients commenting on the number of price reductions they’re seeing before homes go pending – they’re seeing it too. Let’s dive back in.
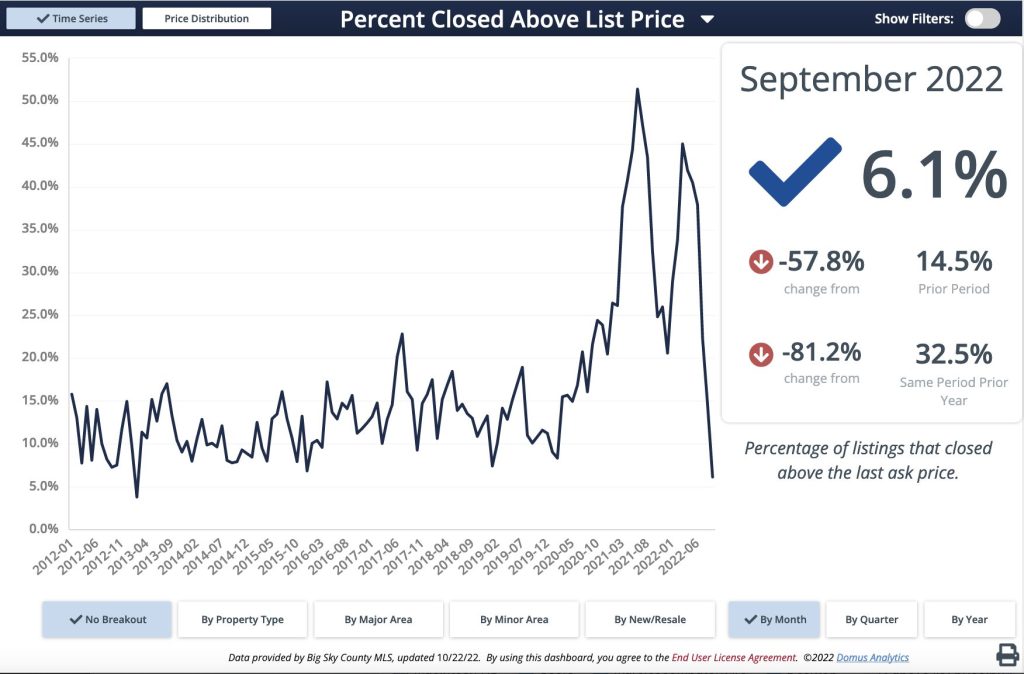
The market was put under tremendous pressure during 2020 and 2021 by the rush into western real estate fueled by the pandemic, politics and social unrest. Buyers were competing with one another to ‘win’ properties, waiving contingencies and most times paying more than list price for the property. At the start of 2020 it was typical to see around 10% of properties selling for more than list price. During the heart of the boom years 50-60%+ of properties were selling for more than list price in Gallatin County. Now it’s down to around 6% – this is back to normal. The frenetic rush and energy that went with the competitive buyer’s market is pretty much gone – thankfully for everyone as it wasn’t sustainable. Buyers are taking more time to shop and there is negotiation happening on terms and conditions. It’s more of a balanced market – but after two years of intense pedal to the metal sort of a market, it feels slower for everyone.
Also, many properties were priced off the rising market and as the pricing has leveled to start of year/end of 2021 pricing, these properties were stranded with too high of a listing price. Proactive agents and brokers have educated their clients about the market and the need to stay with the market in their pricing, even if that pricing is lower than it was last spring or early summer. Buyers have not yet become comfortable with offering much less than list price due to years of having to rise above list price just to get the property. So sellers are many times having to drop their prices to gain buyer attention if they haven’t moved after a bit of time on the market.
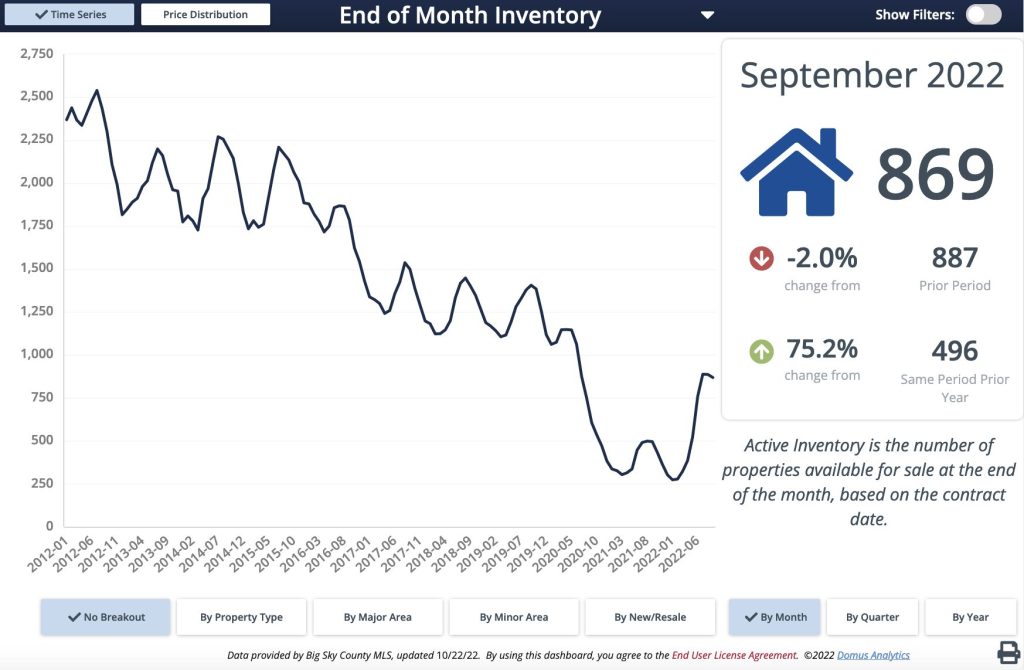
There have been more expirations and cancellations on listings in the past few months as some sellers feel the need to take properties off the market to ‘wait it out’ (just what they’re waiting for is a question mark – as other than the rates piece, even with eroding appreciation it’s still amazing what prices have done in the past few years) – which has again helped to create more of an inventory vacuum.
It’s a fantastic time to be a buyer as you can take some time, breathe and find the property you’d like perhaps with typical contingencies and some room for negotiation and it’s not a terrible time to be a seller either. The median sales price appreciation from this time in 2019 (3 short years ago) is absolutely huge – ranging from 55-75% appreciation over three years. Wow – there is some massive equity for anyone that purchased just a short time ago. And now, if a seller were to sell, there might be something to buy!
Single family homes
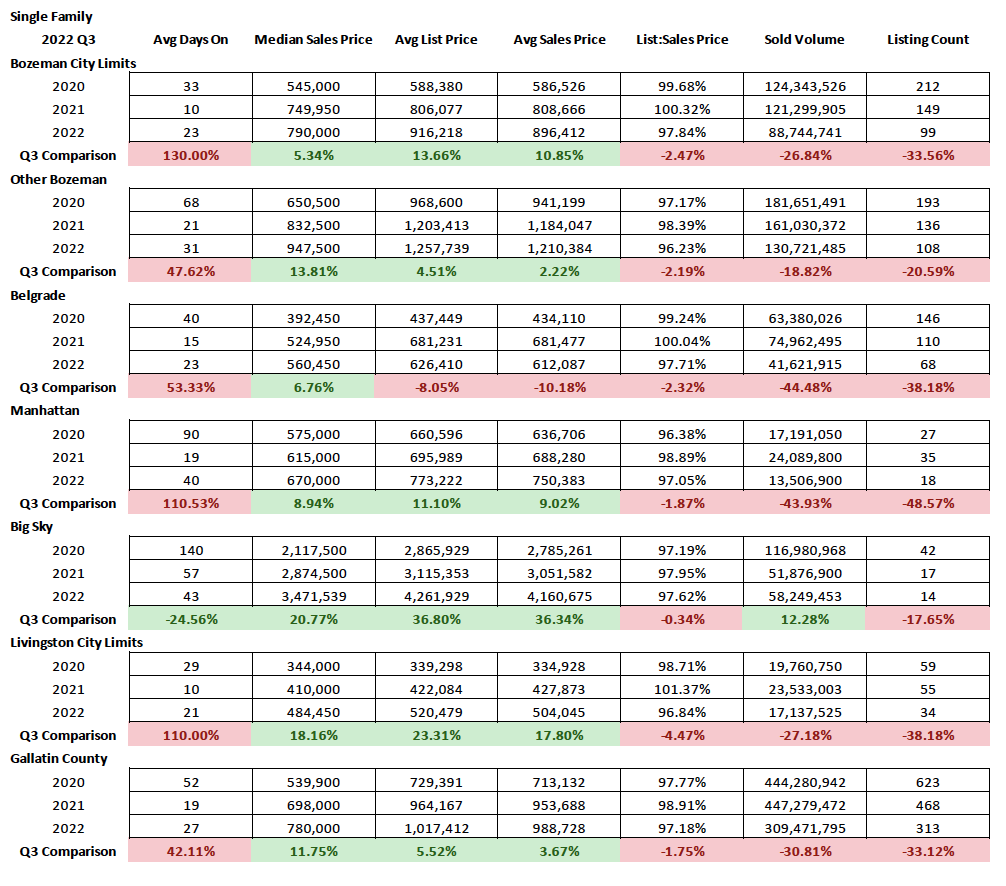
Single family homes have seen jumps in appreciation year over year with flat appreciation from the start of 2022. It’s a leveling market. Number of listings sold has reduced and didn’t peak this spring like it had during the years prior but the anomaly of the past two years has receded and we seem to be falling more into a seasonal rhythm. List to sales price ratios have dropped dramatically as the appreciation from the start of 2022 was eaten into – with over 100% typical earlier in the year and down to 92% original average list to sales price ratios (how much was taken off the original list price, not a price reduction price once sold) not uncommon with 94-97% of List to sales price ratios typical depending on area and product. The amount of listings on market now is still significantly less than the typical inventory we had available prior to 2020.
Condos and townhomes
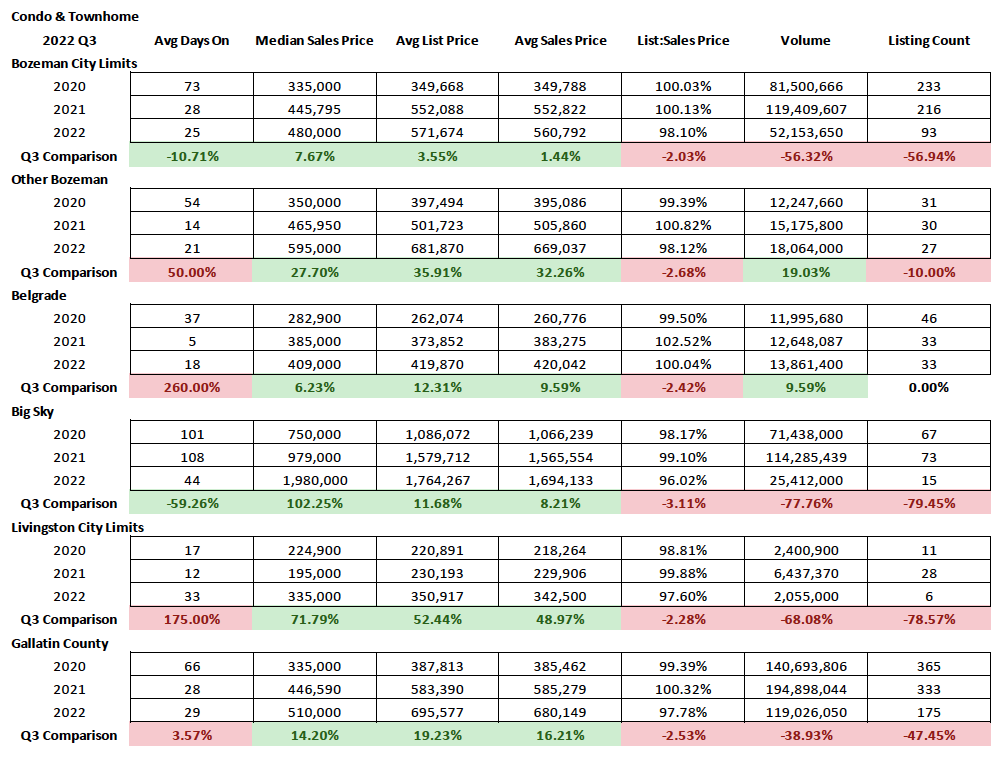
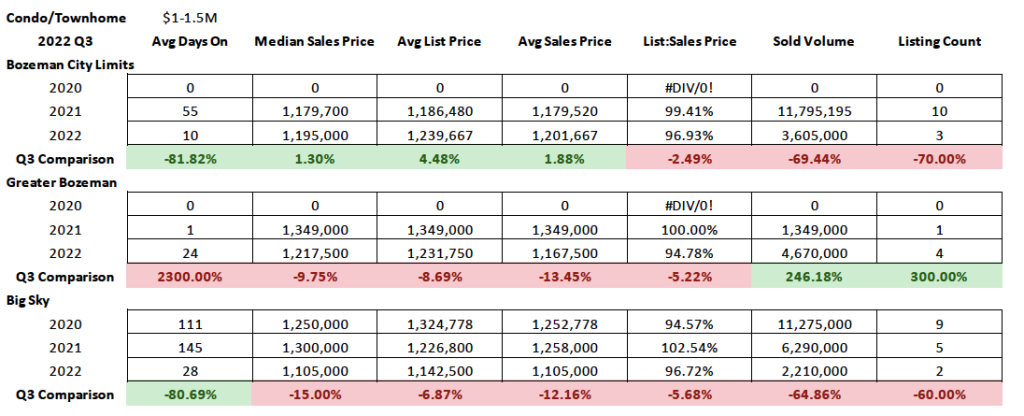
Because condos and townhomes tend to be a more ‘affordable’ product, they can be more affected by interest rates – though a decent percentage of these are paid with cash so interest rates may not have as big of an impact. Year over year the median sales price has jumped more in Greater Bozeman, Belgrade and Big Sky then in City of Bozeman and is still showing some appreciation for 2022. Livingston really jumped as resales for condo products and some newly built inventory pushed pricing higher. There does appear to be some leveling out in the market however. Number of units sold in Gallatin County area down by about half. Part of this is the interest rates and part of it is due to lack of quality inventory. The number of active listings on market now is still significantly less than the typical inventory we had available prior to 2020. List to sales price ratios shows averages of 96-98% on average – Belgrade pushing over 100% still.
Land
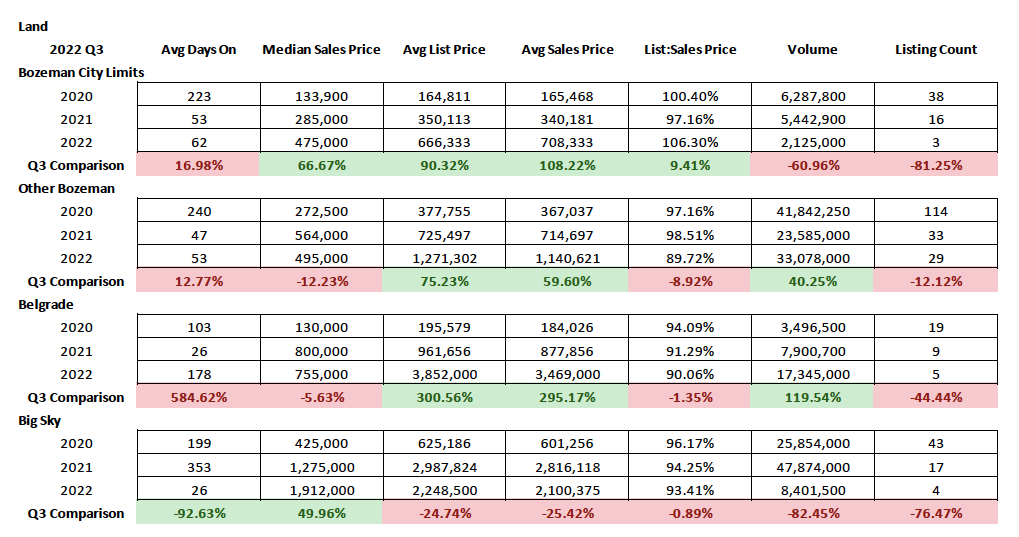
The number of land sales has dropped off but not as significantly as one might think. There is still very little inventory available for purchase. List to sales price ratios show an uptick in negotiation between buyers and sellers with 7-10% off list price on average depending on area – however City of Bozeman saw over 100% with buyers paying more than list on average. Land is still very attractive for many buyers coming to our area that have not been able to find the built product that suits them – custom home building is still very popular. Even with higher commodity prices and contractor timing issues.
Luxury & High End Properties
Single family
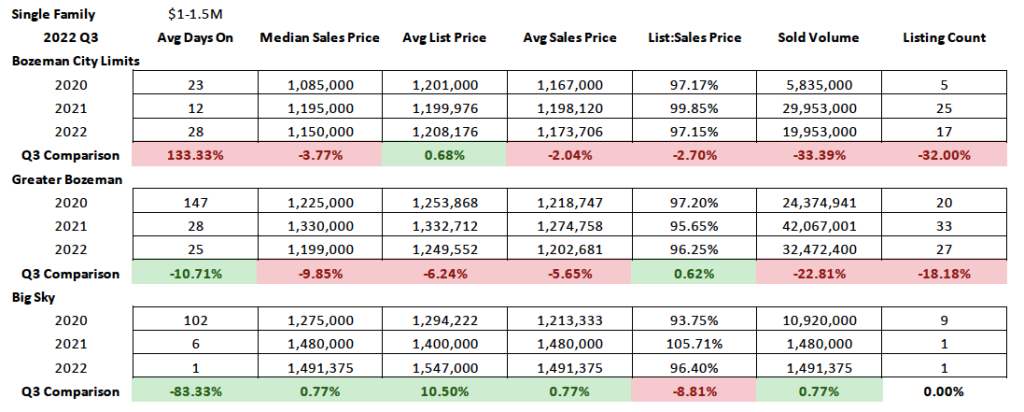
High end ($1M-$1.5M) homes are still moving even in this different market. However there are more listings in this price point sitting on the market than in any time in the past. There is quite a bit of negotiating happening in this segment of the market, with list to sales price ratios showing discounting of 3-4% off list price and 5-10% off original list price on average.
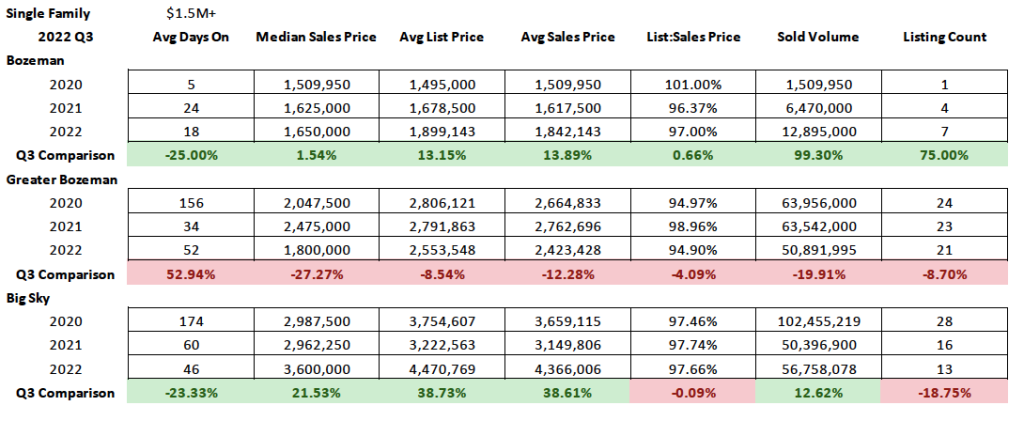
Luxury ($1.5M+) homes are also still moving in this market. There are also 50% more listings than average prior to the pandemic of properties sitting on the market. Partially this is due to the increase in sales price and also due to dynamics of slowing buyer demand. Homes that have updating to do are generally moving more slowly unless priced appropriately – sometimes incorporating in the discount up front – unless they have some sort of special feature that is unique to the property (location, amenity). List to sales price ratios show 2.5-6% discounting on average depending on area and around 7% off original list price on average.
Condo townhome
High end ($1M-$1.5M) townhomes and condos are also still selling, though there has been less inventory moving in all areas compared to 2021 – number of units available on the market is back to a typical level of pre 2020. List to sales price ratios shows discounting of 5-6% on average with about 6% off original list price on average.
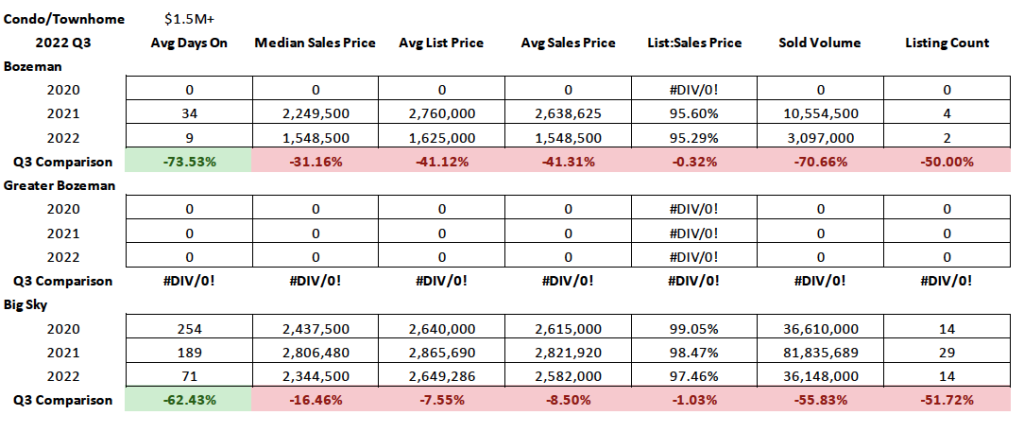
Luxury ($1.5M+) townhomes and condos are also still selling. Days on market are down on these units – perhaps showing a flight to quality at lower price points over freestanding single family homes. Number of units sold in 2022 more closely resembles 2020 over 2021. There are more listings on market now than any time previously. Partially this is due to developers offering more luxury inventory that is not yet deliverable. List to sales price ratios show discounting of 3-5% on average with about 6% off original list price on average.