For a graphical chart version of this information, please visit our Market Stats page.
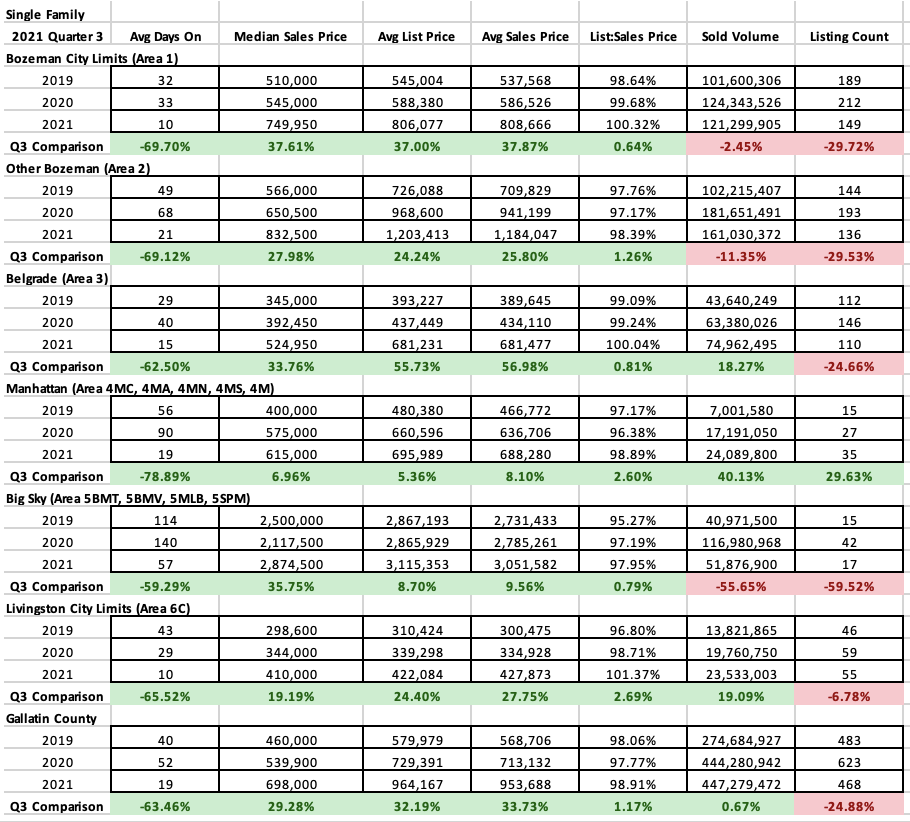
Single Family
Single Family homes sales in Q3 2021 have skyrocketed over Q3 2020. Q3 2020 is when much of the recovery from the Pandemic induced flattening of the market in Q2 2020 and there was a healthy jump over Q3 2019. We saw two sizeable appreciation cycles during spring 2021 and prices now appear to be leveling at the ‘new normal’. There are price reductions on properties where sellers shot too high but there remain multiple offer situations on well priced and desirable properties without much regard to price point.
Single family median sales prices have jumped 38% in City of Bozeman to $750K, 28% in Greater Bozeman to $833K, 34% in Belgrade to $525K, 7% in Manhattan to $615K, 36% in Big Sky to $2.85M and 19% in Livingston to $410K.
Inventory remains an issue – the number of homes sold in the Bozeman and Belgrade areas are down 25-30%, Big Sky is down 17% and Livingston is down 7%. Home sales for 2020 had trended upwards from 2019. But almost across the board number of units sold is either flat to slightly below 2019’s numbers.
List to sales price ratios show that buyers are discounting very little if at all – less than in previous years – off list price as the market remains competitive. In some markets (Livingston and City of Bozeman) the list to sales price ratios show an average offering of above list price.
Days on market have dropped considerably in all areas as buyers scoop up inventory. Average days on market have reduced 70% in Bozeman to 10 days, reduced 70% in greater Bozeman to 21 days; reduced 63% in Belgrade to 15 days; reduced 80% in Manhattan to 20 days; reduced 60% in Big Sky to 57 days; reduced 65% in Livingston to 10 days.
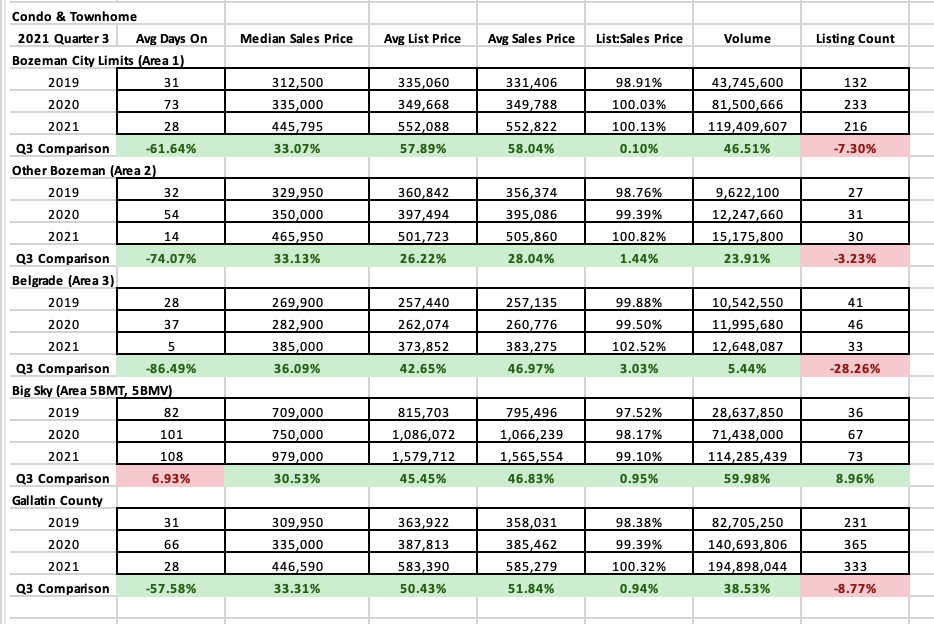
Townhomes and Condos
Condos and townhomes continue to be a hot sector of the market with record appreciation in Q3 2021 all areas tracked over Q3 2020. Compared to the modest appreciation in 2020 over 2019 during the rebound from the initial effects of the Pandemic this is the most dramatic appreciation we’ve seen historically.
Condo and townhome median sales prices have jumped 33% in City of Bozeman to $446K, 33% in Greater Bozeman to $466K, 36% in Belgrade to $385K, and 31% in Big Sky to $980K.
Sold inventory is down in City of Bozeman and Greater Bozeman slightly and considerably Belgrade as new construction there has slowed but ticked up in Big Sky as inventory has loosened a bit as 2nd home investors cash in on new pricing.
List to sales price ratios shows most buyers in most areas paying on average above list price – a trend we’ve seen become commonplace driven by multiple offers and competition for properties.
Days on market are down in all areas but Big Sky which is flat at 108 days. City of Bozeman is down 62% at 28 days, Greater Bozeman is down 74% to 14 days, City of Belgrade is down 87% to 5 days.
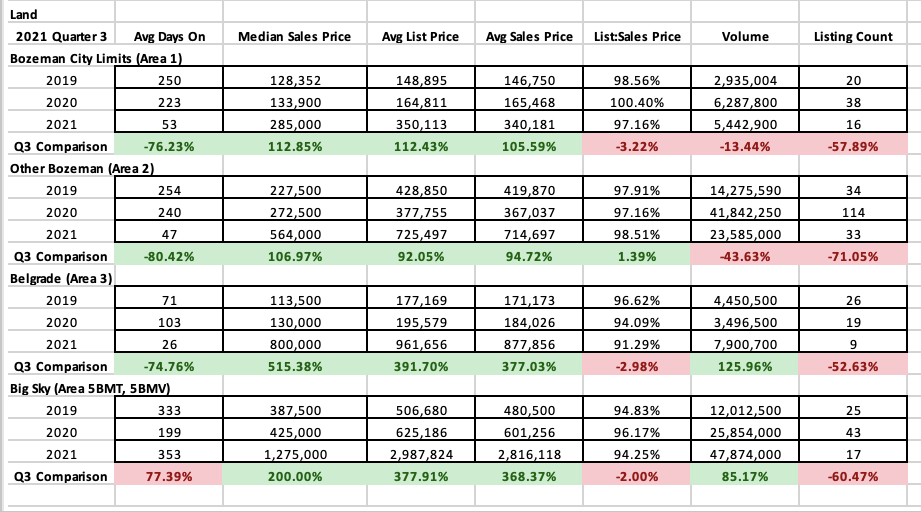
Land
Land has continued to be super desirable as many buyers who cannot find a good fit in existing inventory have chosen to build – even as build costs have hit historic highs.
Median sales price in all areas is up at record appreciation levels – even after big jumps in 2020 over 2019. Median sales price for City of Bozeman is up 112% to $285K, Greater Bozeman is up 107% to $564K, Belgrade is up 515% (that is not a typo) to $800K (also not a typo) and Big Sky is up 200% to $1.275M.
There is far less inventory available as the backlog of available land parcels that sat for sometimes years not longer exists. City of Bozeman is down 58%. Greater Bozeman is down 72%, Belgrade is down 53% and Big Sky is down 60%.
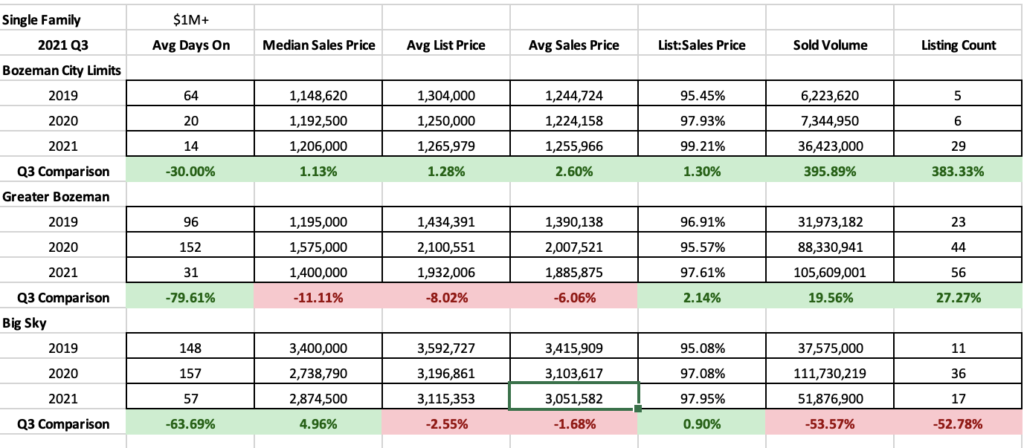
Luxury
Single family luxury homes ($1M+) have seen a huge jump in the Bozeman and Greater Bozeman markets and a decline in the Big Sky market in Q3 2021 over Q3 2020. Part of this acceleration is increase in median sales price but also that the luxury market is moving at a historic pace in SW Montana. City of Bozeman is up 383% with 29 listings sold. Greater Bozeman up 27% with 56 listings sold. Big Sky declined 53% to 17 listings sold.
The issue in Big Sky is based on inventory – there hasn’t been much in the way of built product available. There was a big surge in Q3 2020 as inventory was eaten through – and the listing sold numbers for 20201 in Big Sky are higher than 2019 but significantly off of 2020.
List to sales price ratios indicate that buyers in the Bozeman market are only slightly discounting properties – in Greater Bozeman and Big Sky discounting is about 2-2.5% on average.
Days on market are down significantly as stale inventory has been for the most part absorbed. Days on market are down 30% in City of Bozeman to 14 days on average. Days on market are down 80% in greater Bozeman to 31. Days on market in Big Sky are down 64% to 57 days.
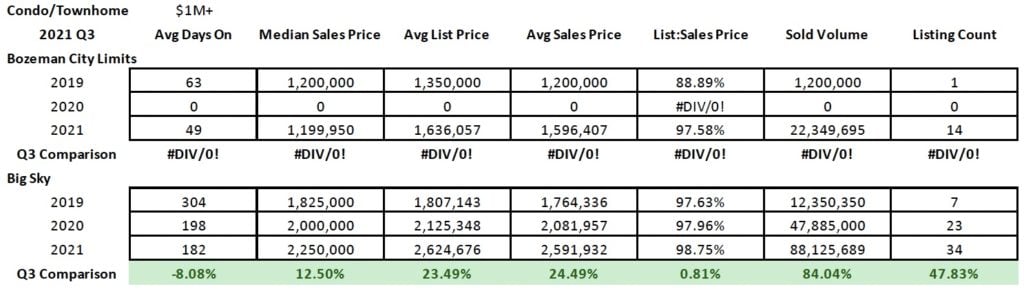
Condo/Townhome luxury properties ($1M+) have see a huge jump in Big Sky and Bozeman – the areas tracked. There were 14 sold listings in Bozeman, up from 1 in 2019 and 0 in 2020. Part of this is that there has been some new construction in this price point but also that resales are starting to take place on built product that is 2-3 years old in downtown Bozeman in this price range. Big Sky saw 34 listings sold – up 48% – in part due to new construction closings in Meadow Village, Moonlight Basin and Spanish Peaks.
Days on market are down in Big Sky to 182 days on market – the length having to do with completion of new construction. Days on market are established at 49 days for City of Bozeman.
List to sales ratios indicate that buyers are discounting 2.5% in City of Bozeman and 1.25% in Big Sky – both indicative of very strong seller markets.