
2023 posted the least amount of volume and number of units sold in the past three years – however there was perhaps less of a marked shift in the market when comparing year over year than comparing by quarter. Higher than recent historic interest rates in combination with sellers not wanting to part with their current low interest rates (i.e. trade up or trade down selling was muted) created an overall slower pace in the market – but median pricing was not heavily affected overall and in some circumstances it has jumped year over year. Investors have remained a smaller percentage of buyers as interest rates have forced many out of the current buyer pool. It remains to be seen how this year’s potential for FED rate reductions will affect the market. There are many buyers that had previously sidelined their searches that appear to be trickling in – accepting that higher rates are here to stay for the time being and looking forward towards the opportunity to refinance at a lower rate should rates drop more.
Single family
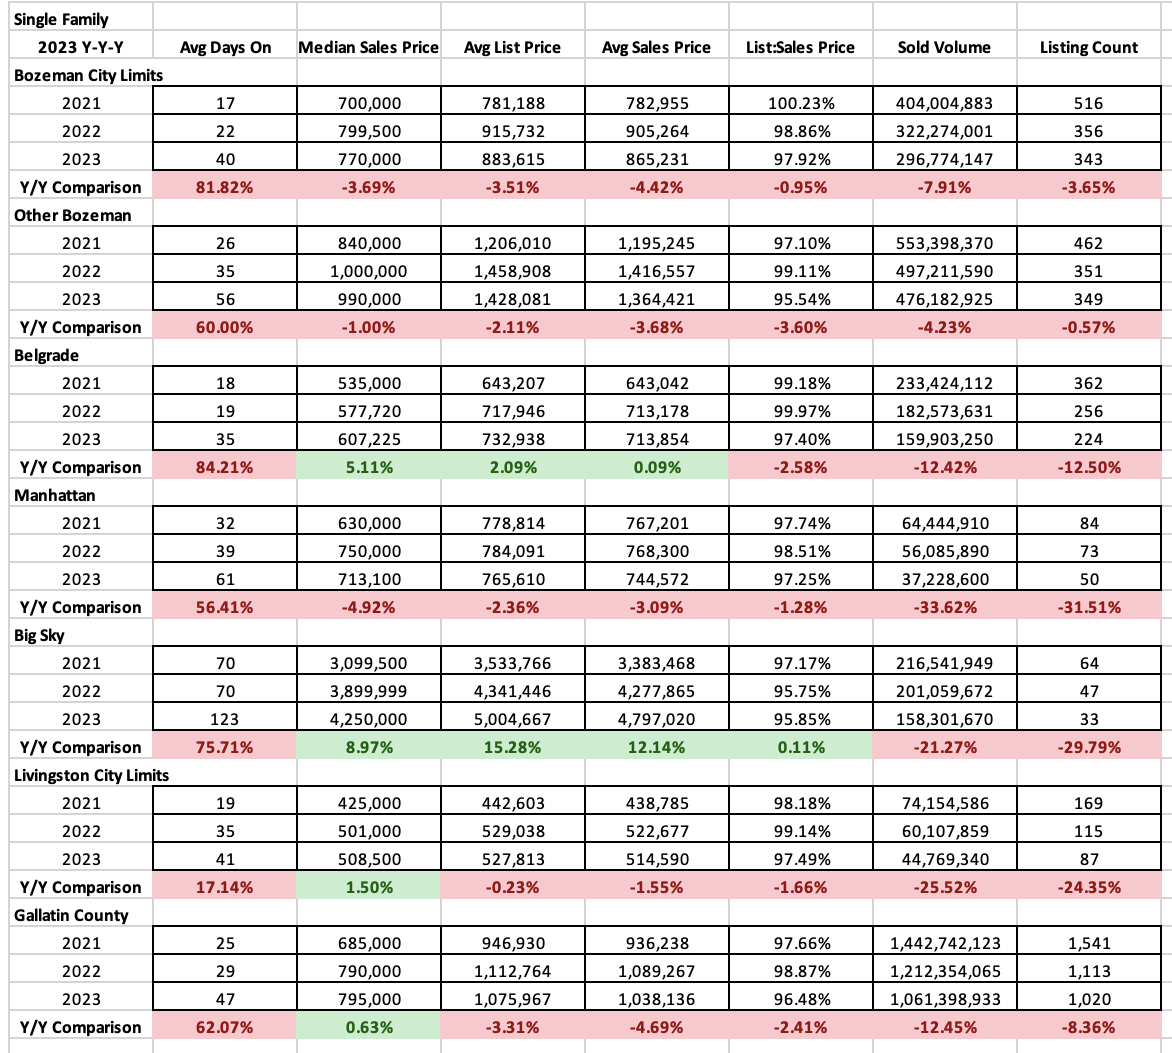
Single family homes overall saw a mix of fairly flat to modest appreciation over 2022 with pricing still well above 2021 – the banner year for our area – median prices. Median sales price was off close to 3.75% in the City of Bozeman ($770K), off 1% in Greater Bozeman outside city limits ($990K), and off 5% in Manhattan ($713K). Median sales price was up 5% in Belgrade ($607K), 9% in Big Sky ($4.250M) and 1.5% in Livingston ($508K).
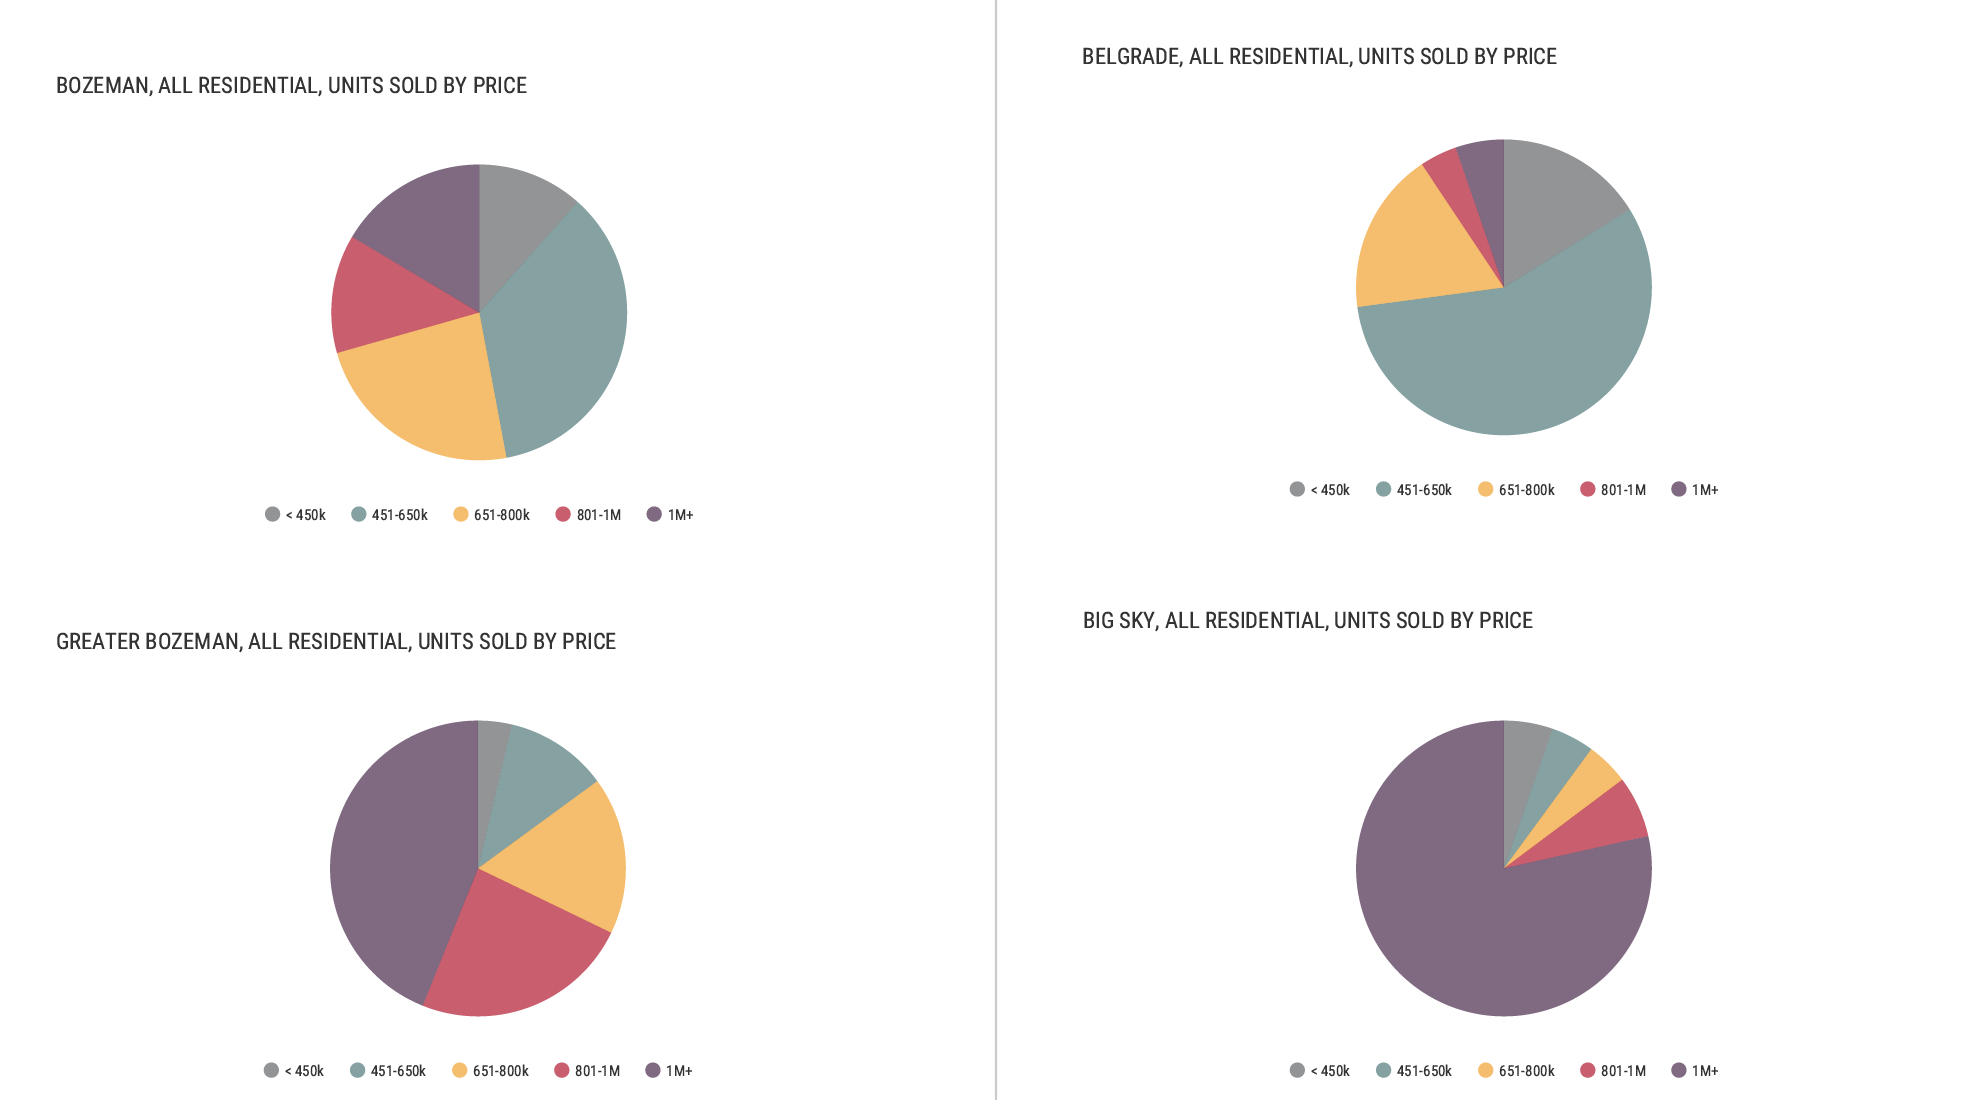
Number of units sold was flat or down in all areas – down 3% in City of Bozeman, 0.5% in greater Bozeman, 12.5% in Belgrade, 32% in Manhattan, 30% in Big Sky and 25% in Livingston. Volume of sales has dropped significantly but is still above historic levels pre-Covid. Number of listings sold though is far below what we normally would have seen pre-Covid. Showing properties are selling for more but significantly less properties are selling.
Days on market have increased significantly in all areas – up 50-80% in all areas tracked with the exception of Livingston which is up 17%. Buyers have become more hesitant to offer as the ‘pressure’ is off – however there has been an uptick of multiple offers recently for well priced, well positioned properties.
List to sales price ratios indicate buyers are discounting off list price for final closed pricing but not by much – on average 2-4.5% in all areas tracked. They are discounting off list price slightly more than in 2022 but not by much. These figures are indicative of a balanced market.
Condo/Townhome
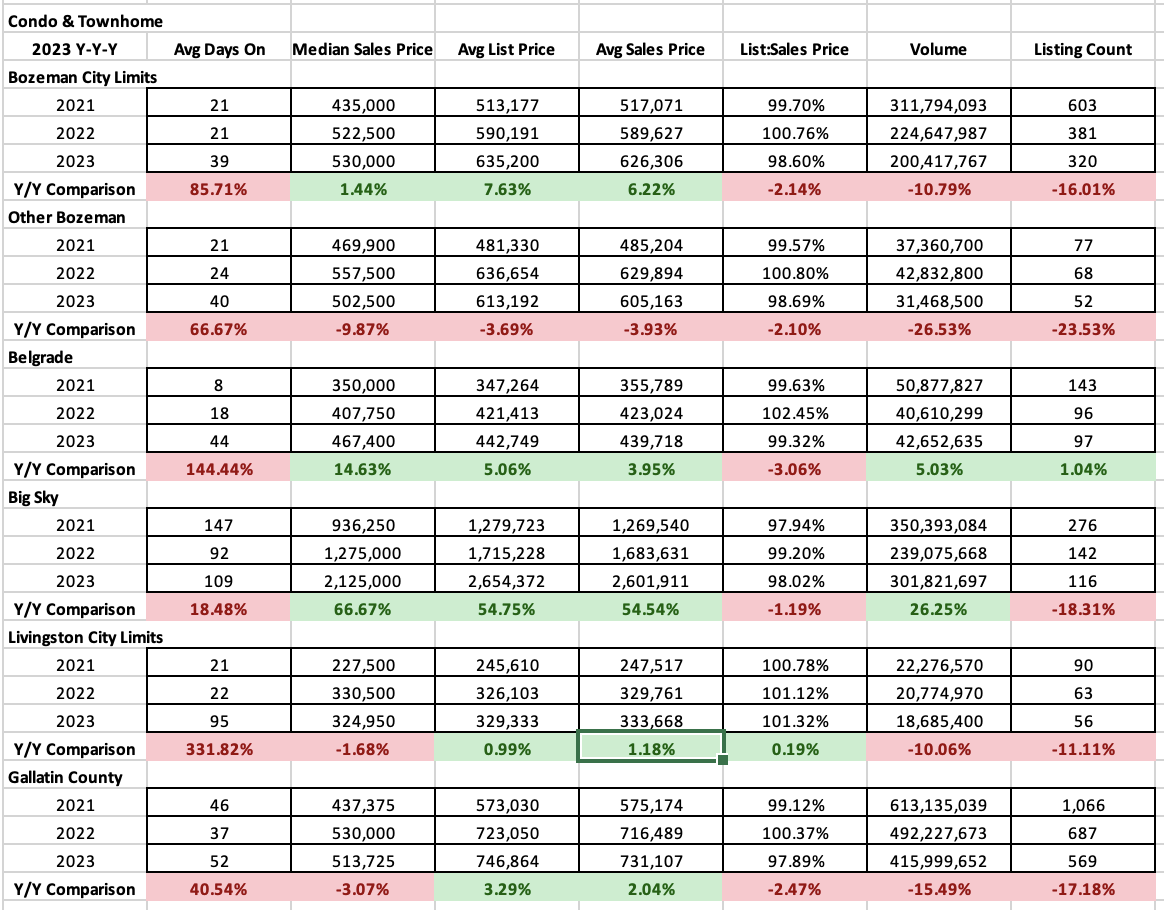
Condos and townhomes remain a more affordable option for many buyers – especially as interest rates have climbed. As a result, median sales price in many areas increased. City of Bozeman stayed about flat ($530K) as did Livingston ($325K). Belgrade increased by 15% ($467K), Big Sky increased by 67% ($2.125M( – partly a function of new construction condos that have been pending for over a year that are finally closing. Greater Bozeman was off 10% ($502K).
Number of units sold was flat or down in all areas – similar to single family sales – pointing to a across market slowness in sales. Bozeman was down 16%, greater Bozeman was down 23%, Belgrade was flat, Big sky was down 18% and Livingston was down 11%.
Days on market were also up in all areas – up 60-300% depending on area with the exception of Big Sky which was up by 18% – again a function of many properties now closing having gone pending in a more competitive market since they were multi-year new construction projects.
List to sales price ratios show that there is very little discounting taking place on condos and townhomes – between 1-2% on average and Livingston was actually above list price on average. This is indicative of a tilted towards seller’s market.
Land
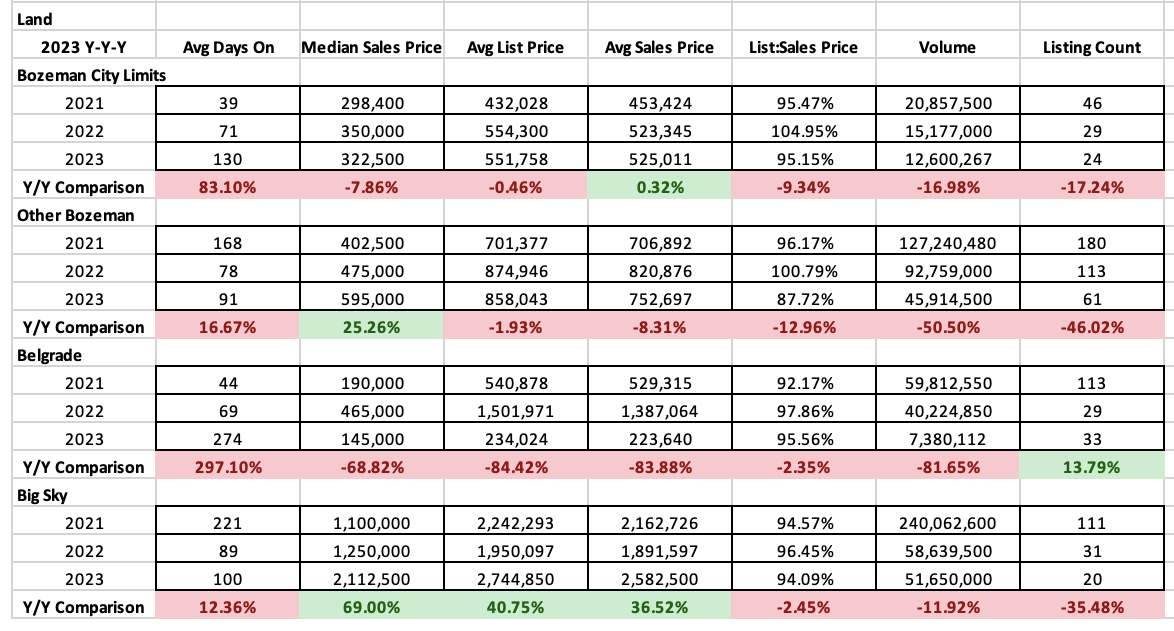
Land sales have slumped more than other sectors of the market. However, sales have not crashed and have experienced a manageable decline. Median sales prices are stable or even up in all areas of the market.
Median sales price has decreased 8% in City of Bozeman ($323K), increased in greater Bozeman by 25% ($595K), dropped in Belgrade by 68% ($145K) due to new land offerings that have come available at a lower price point in town and increased in Big Sky by 69% ($2.11M).
Number of units sold were off by 18% in City of Bozeman, 46% in greater Bozeman, up by 43% in City of Belgrade due to the new inventory available, and down 35% in Big Sky.
Days on market were up across the area – up 12-300% depending on area.
List to sales price ratios have adjusted significantly as may sellers have overpriced their properties and are taking a discount on sale. City of Bozeman is discounting at 5%, greater Bozeman at 13%, Belgrade at 4.5% and Big Sky at 6% on average.
Luxury and High End Single Family Homes
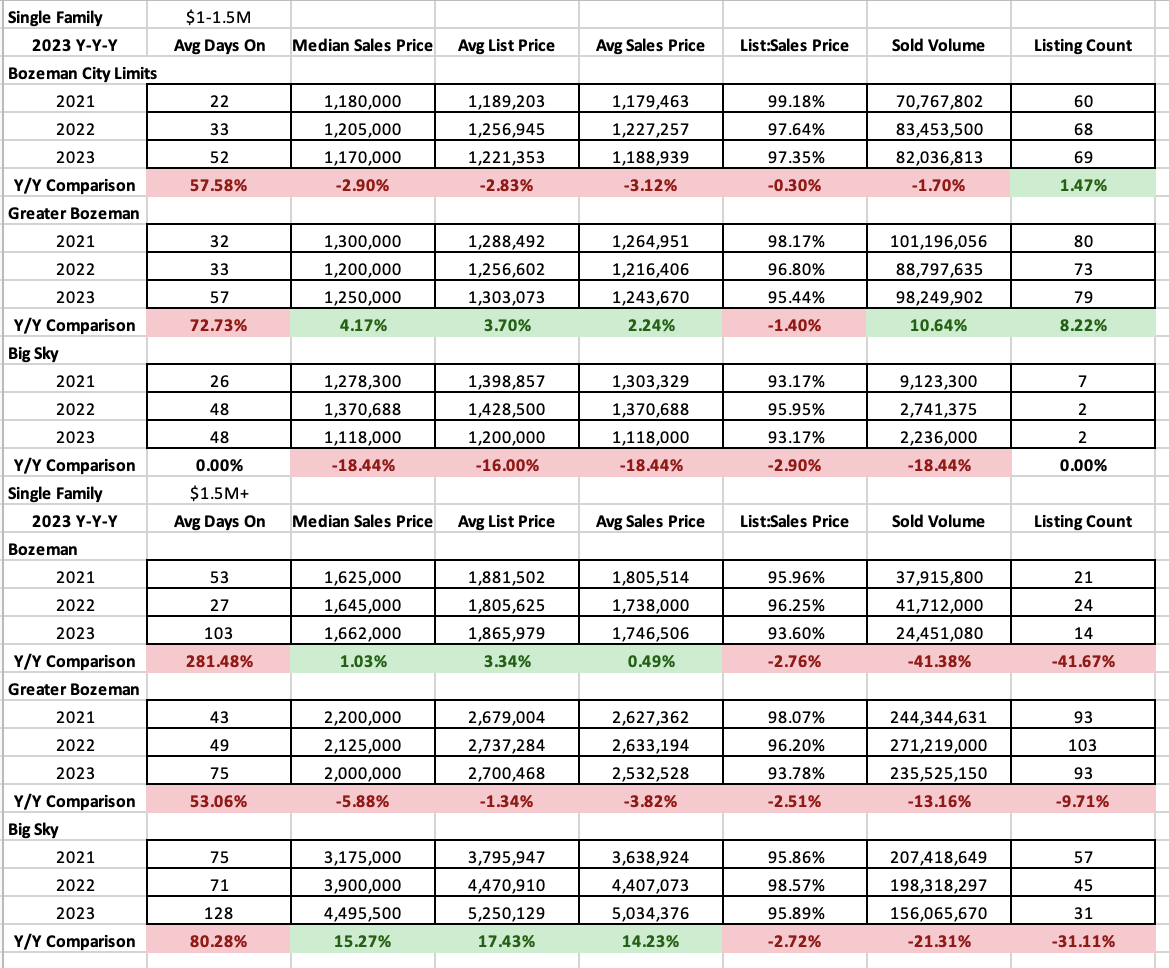
High end homes – those priced $1M-$1.5M – saw continued strength in market overall in 2023. A similar number of homes sold in both Bozeman City limits, greater Bozeman and Big Sky as in 2022. Days on market were up in Bozeman and greater Bozeman – on average just less than 2 months and flat in Big Sky as around 1.5 months, though to bracket Big Sky there were only two sales. List to sales price ratios showed very little movement in the amount of discounting that buyers were taking off list price. On average this was 2.65% in City of Bozeman, 3.5% in greater Bozeman and 6.5% in Big Sky.
Luxury homes – those priced $1.5M and higher – saw continued sales but the number of homes sold was off 42% in City of Bozeman, 10% in greater Bozeman and 31% in Big Sky. Days on market were up from about a month to 3+ months on average in City of Bozeman, up from 1.5 months to 2.5 months in greater Bozeman and up from 2.5 months to 4+ months in Big Sky. List to sales price ratios show average buyer discounting ranging from 4.5-6.5% on average.
Luxury and High End Condo/Townhomes
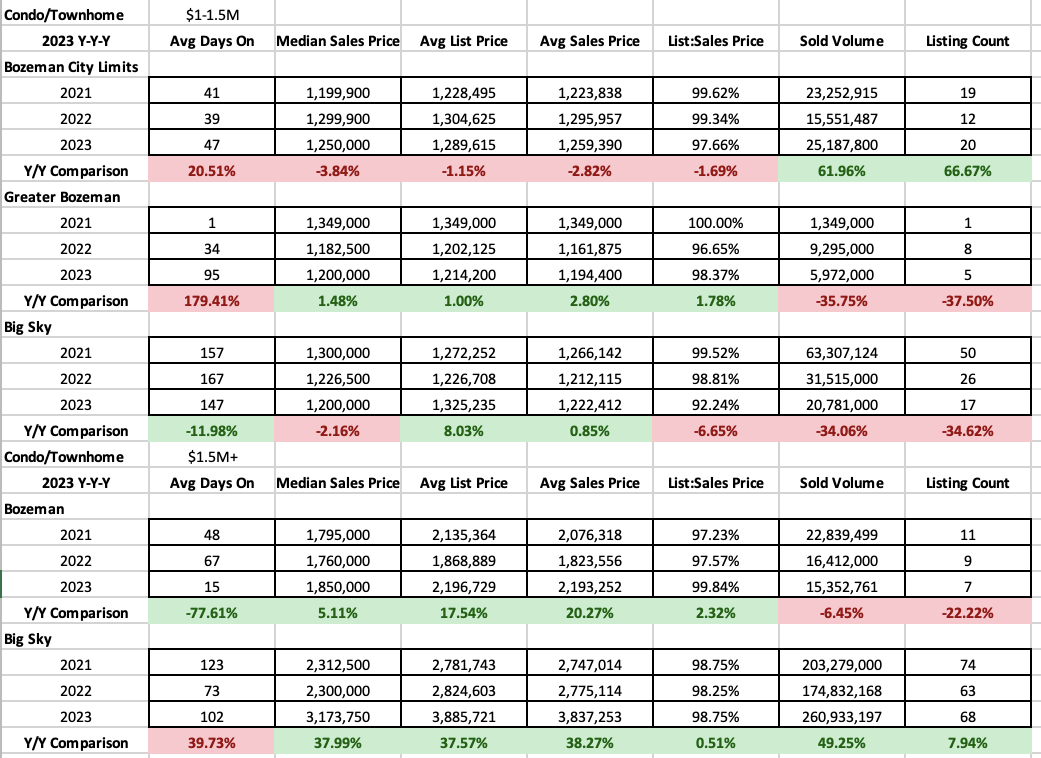
High end condo and townhome sales – those priced between $1M-$1.5M saw a jump in number of units sold in City of Bozeman (as new construction units came to market), with a reduction in sales by 30+% in greater Bozeman and Big Sky. Days on market were up slightly in City of Bozeman to 1.5 months on average, up from 1 month to 3 months on average in greater Bozeman and down slightly in Big Sky to close to 6 months on average. List to sales price ratios show little discounting in Bozeman (2.5%) and greater Bozeman (1.7%) and more significant discounting in Big Sky (7.75%) on average.
Luxury condo and townhome sales – those priced $1.5M and higher – saw steady sales in 2023. Bozeman was down a touch but about flat year over year. Big Sky was up very slightly. Days on market were down significantly in City of Bozeman to a couple of weeks – Big Sky grew to close to 3+ months on average. List to sales price ratios show very little discounting – partially due to the new construction nature of what has been closing – in both areas – with less than 0.25% discounting in Bozeman and 1.25% discounting in Big Sky. Very indicative of a strong seller’s market still for well done luxury level product.