There was decent – i.e. more NORMAL (i.e. pre 2020 level) – price appreciation for 2022 year over year in most locations and for product that we track in southwestern Montana. An exception to this were areas and products that tend to harbor more entry level pricing. Our analytics point out that the core appreciation experienced during the ‘Covid’ years has not diminished much at all if any.
There were significantly fewer homes and properties sold in 2022 than during the pandemic and even pre-pandemic years (2019 and earlier). This remains in part due to lack of quality inventory and also due to the overall pinch on rates. Investors are fewer and farther between. And primary home buyers are many times less willing to make a vertical leep at higher rates. But there are still many buyers putting homes under contract and moving. Many sellers are waiting (still waiting) to see where the market will go and also because they have locked in low interest rate loans on their current homes and they’re feeling like there is less incentive to move. But there are still sellers selling homes for acceptable prices and some properties have recently experienced competitive bidding with multiple offers.
As comparison of percent of homes sold, Bozeman and Greater Bozeman saw less properties and percentage of properties under $8000K sell in 2022 than in 2021. Belgrade also became noticeably less affordable. Big Sky was almost 75% above $1M in sold price.
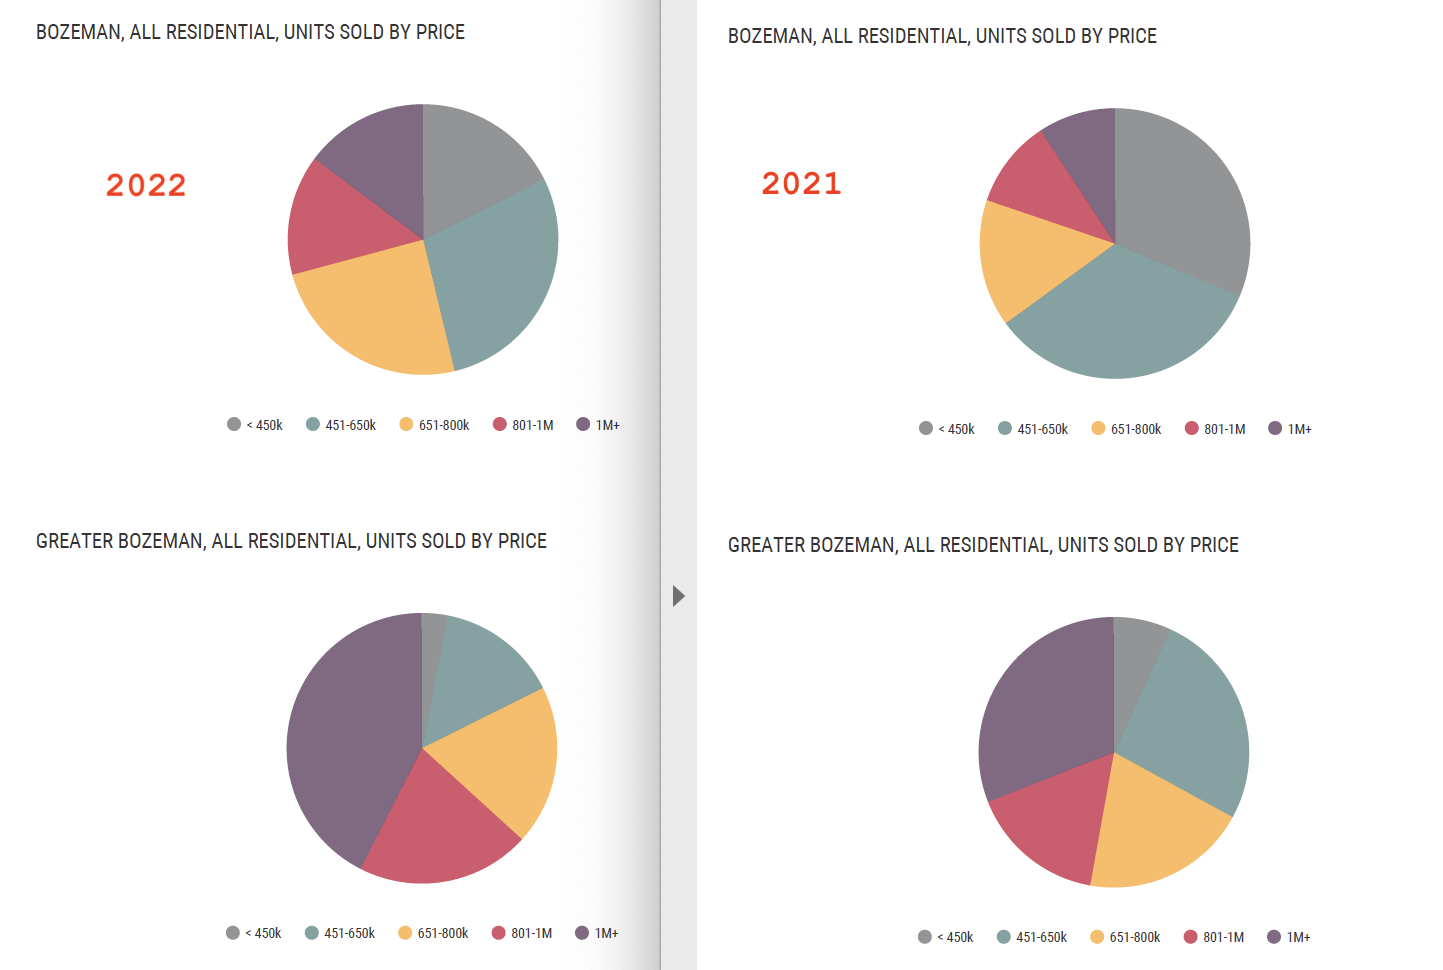
Pie chart comparison of of units sold by price City of Bozeman and Greater Bozeman 2021 vs 2022
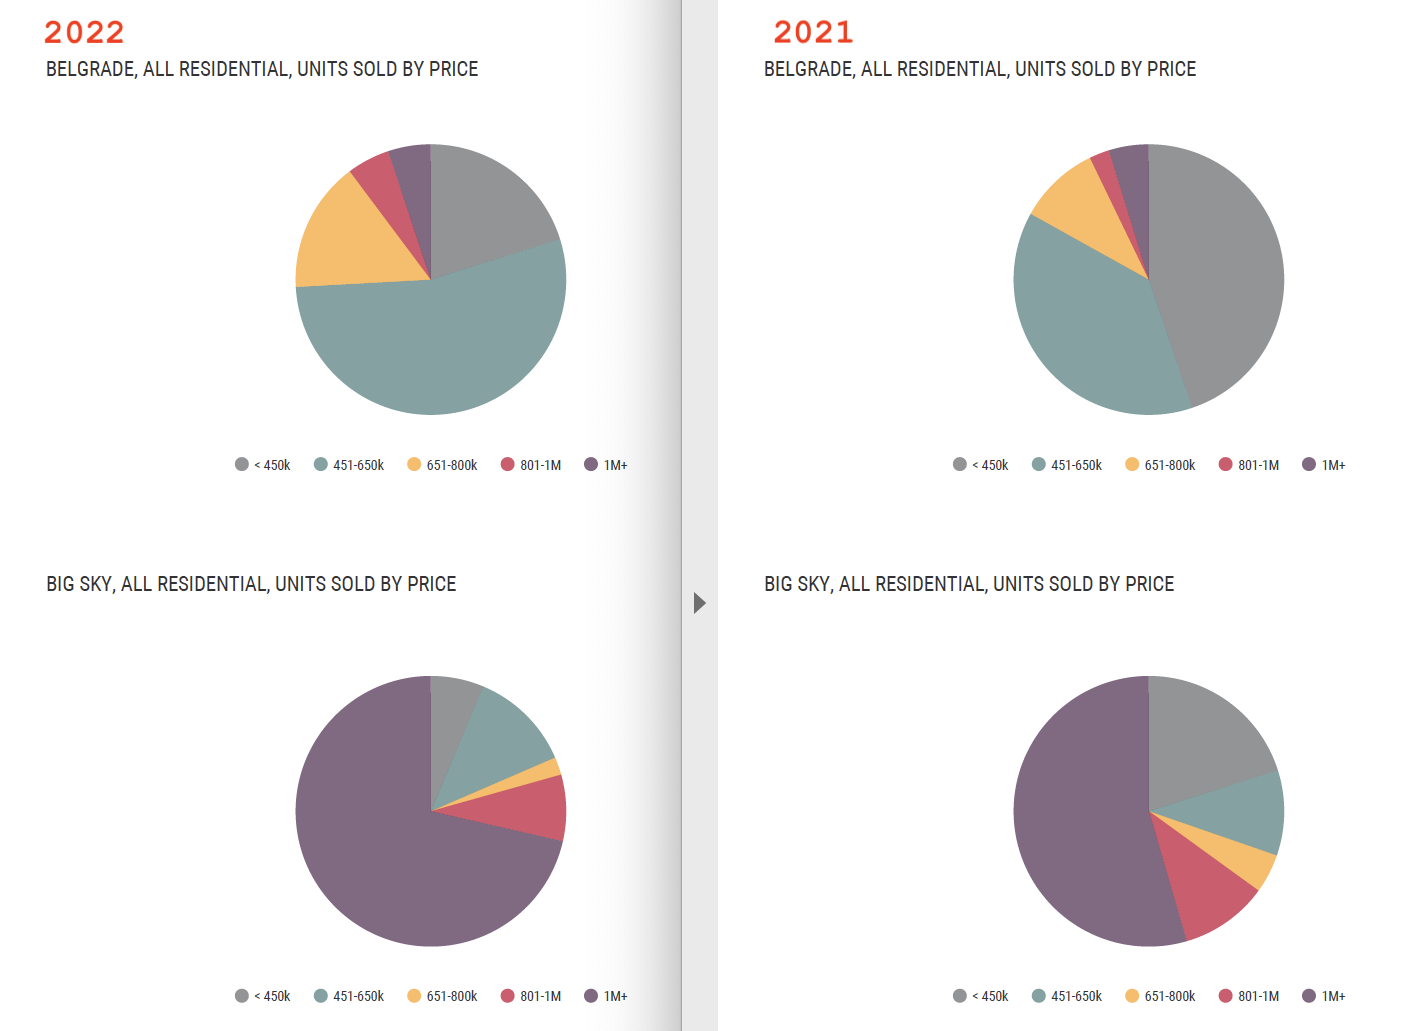
Pie chart comparison of units sold by price Belgrade and Big Sky 2021 vs 2022
There have been less price reductions recently as new inventory has hit that has been priced more realistically. But price reductions are still common. Buyers have not yet become comfortable with offering much less than list price due to years of having to rise above list price just to get the property. So sellers are many times having to drop their prices to gain buyer attention if they haven’t moved after a bit of time on the market.
Many lenders have come up with creative work-arounds on interest rates for primary home purchasers – rates which as a side note have not been all together terrible as they’ve bounced around. Investment and commercial loans have been strikingly more expensive, definitely acting to curb that segment of the market. Many lower priced multi-family offerings are also sitting because they’re not large enough to fall into most 1031 exchange parameters and smaller investors aren’t willing to quite yet move forward with the higher rates. But as time moves on and buyers become more used to these market conditions, feelings on that may change.
Days on market have risen some – but not as high as where they were before the pandemic. These will continue to tick upwards as more inventory hits the market. Average days on market is sitting around one to two months depending on area and what kind of product is being sold.
There have been more expireds and cancellations on listings in the past few months as some sellers feel the need to take properties off the market to ‘wait it out’ (just what they’re waiting for is a question mark – as other than the rates piece, even with eroding appreciation it’s still amazing what prices have done in the past few years) – which has again helped to create more of an inventory vacuum.
Single family
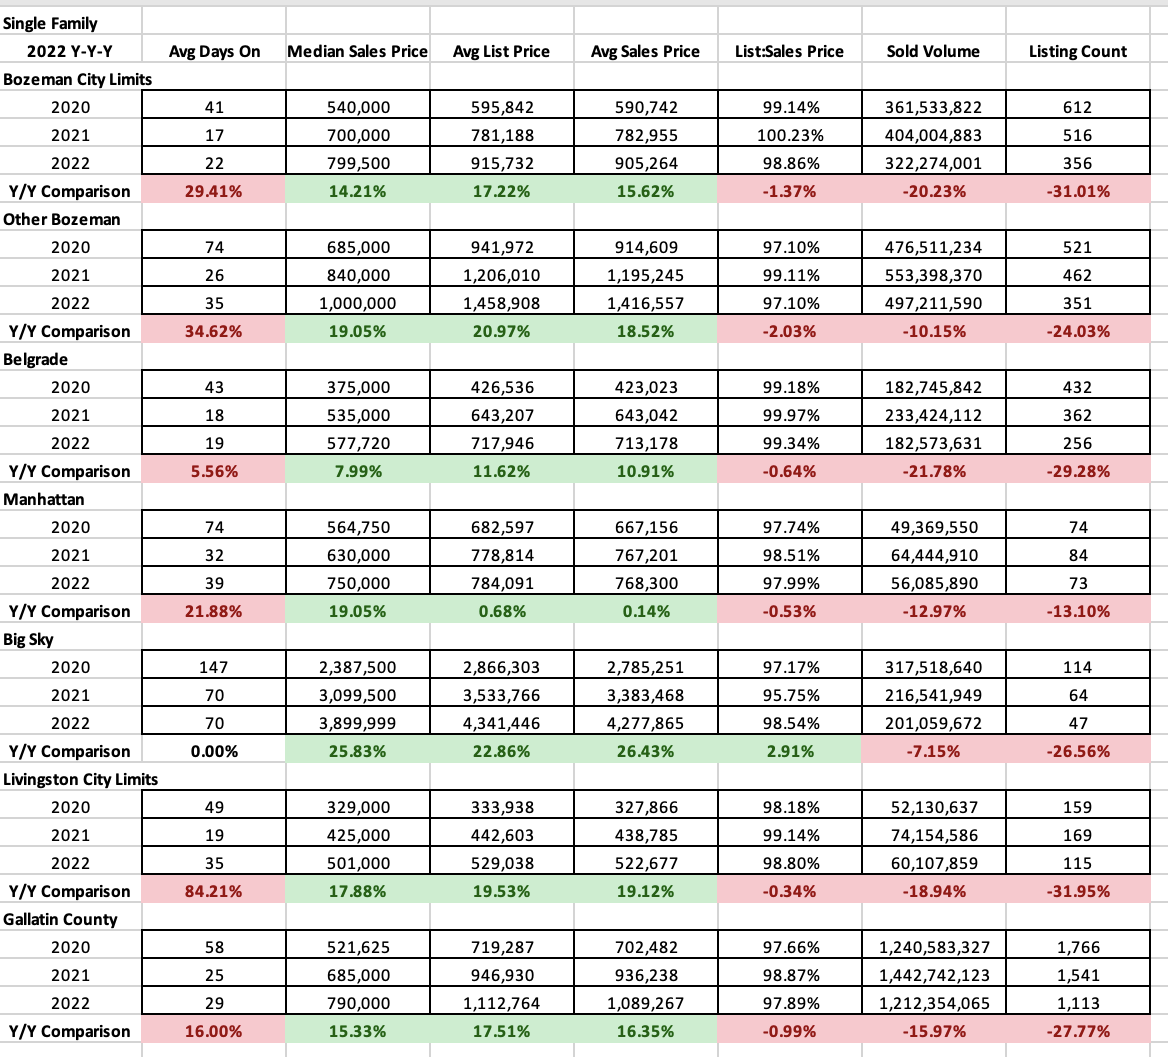
Year over year, median sales price in all areas tracked saw very positive appreciation. Bozeman City limits sat at 14% with median at $800K for the year. Greater Bozeman was at 19% with $1M median for the year. Belgrade was at 8% with $578K median for the year, Manhattan at 19% with median at $750K. Big Sky was at 25% with $3.9M median for the year and Livingston was at 18% with median at $501K for the year.
List to sales price ratios – an indicator of how much buyers are discounting properties off list price – saw a drop in almost all areas with exception of Big Sky. New construction – less likely to be discounted and that went pending long before the closing dates – were likely an influence on Big Sky’s stats. Buyers are on average discounting between .5-3% full year over year off list price. Watch this statistic in the quarterly reports for more movement.
Average days on market have increased in all areas full year over year 2022 over 2021. Significantly. In most areas homes are staying on the market 25-30% longer with Big Sky registering exactly the same as 2021 with 70 days on market average and Livingston falling 85% changing from 19 days on market average to 35 days on market average (still very short time on market). Belgrade has the shortest days on market averaging 19 days.
The big move year over year was the number of properties sold. Sold properties were down 13-32% – with the majority of areas falling in the 25-32% range. This is a huge change – partially fueled by lack of quality inventory and partially due to the end of the buyer pandemic flight to our area – people in search of smaller urban and rural markets. Property owners have been slow to list – first worried about finding replacement property if they sold earlier in the year and now fueled about interest rates and giving up a good rate on their current home to make a move and uncertainty about inflation and the economy.
Condos & Townhomes
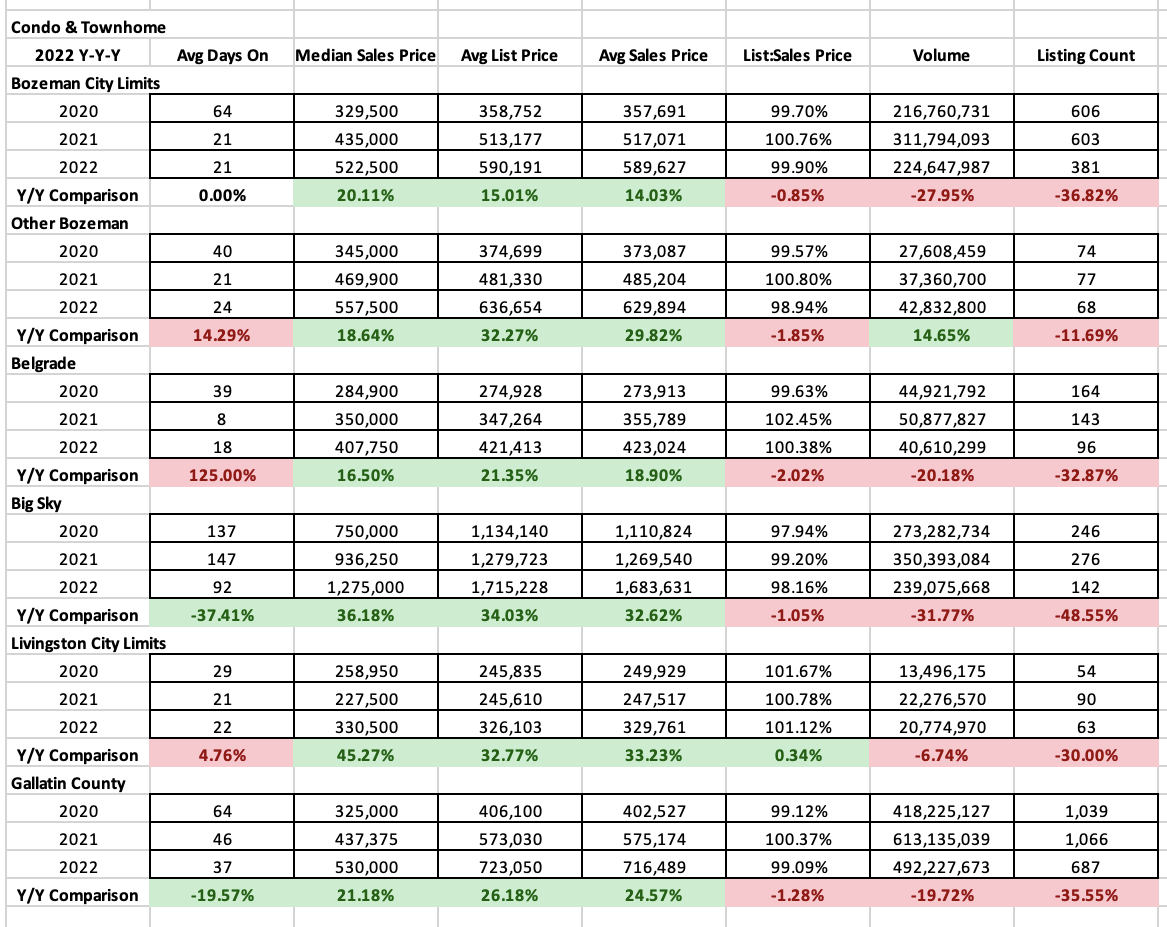
Condos and townhomes also saw positive median sales price appreciation full year 2022 over full year 2021. Typically the more affordable segment of the market, median sales prices moved 20% in City of Bozeman to $523K, 19% in greater Bozeman to $558K, 17% in Belgrade to $408K, 36% in Big Sky to $1.25M and 45% in Livingston to $331K.
List to sales price ratios showed very little discounting in all areas tracked – some areas still reporting over 100% list to sales price ratios (Belgrade & Livingston) showing properties went for above ask on average.
Average days on market were steady or increased in most areas tracked with the exception of Big Sky which hit 3 months as an average. All other areas are under 30 days still on average.
The number of listings sold were also in line with single family trends. Sales were off 12-49% with the majority hovering around 30-36% declines.
Land
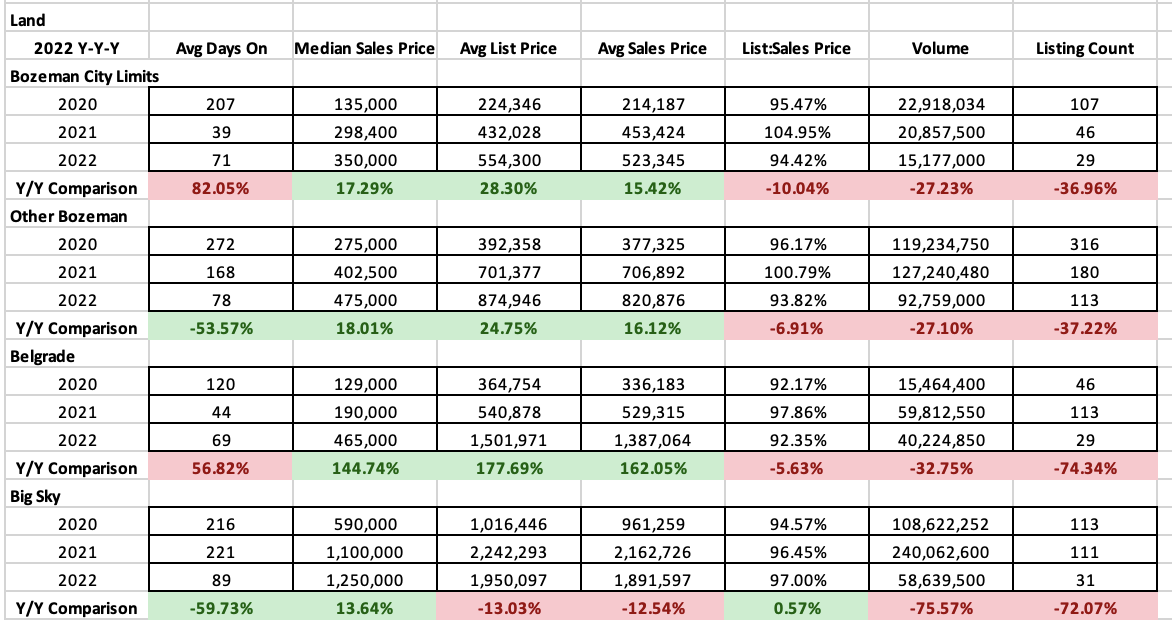
Land sales showed positive median sales price appreciation for all areas tracked – with most areas hovering around 13-18% appreciation. The outlier was Belgrade which saw 144% appreciation as smaller and more affordable subdivision land parcels that had been driving the market became scarce.
List to sales price ratios show that there is more negotiation happening for land than in 2021 – with discounts of 3-7% common in all areas tracked.
Average days on market have leveled across the area to about 2-3 months for marketing time. Interestingly the markets that were typically longer to sell had shortened days on market and the areas that were shorter to sell had longer days on market.
Number of properties sold trended with single family and condo/townhome sales – with significantly less volume than in 2021. Number of properties sold were off 37% in Bozeman and greater Bozeman and 72-75% off in Belgrade and Big Sky. Coming off of a huge year in 2021 – numbers are still significantly less than in 2020 for all areas. Partially due to lack of new subdivisions for lot purchase opportunity and lack of general inventory.
High End and Luxury
Single Family
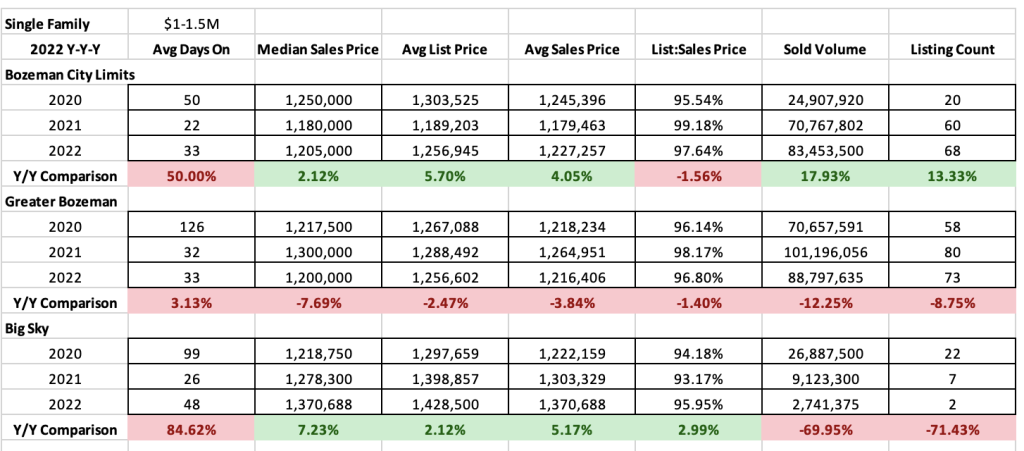
High end ($1M-$1.5M) homes experienced median sales price gains in the Bozeman market and Big Sky and loss in Greater Bozeman. List to sales price ratios showed more discounting year over year in Bozeman and Greater Bozeman around 2.25-3.2% on average. And less discounting in Big Sky at 4% on average. Days on market were up in all areas but still averaging 30-60 days. Number of listings sold in this segment were up 13% year over year in City of Bozeman and down slightly in greater Bozeman. In Big Sky they were down significantly as the price point eclipsed this segment.
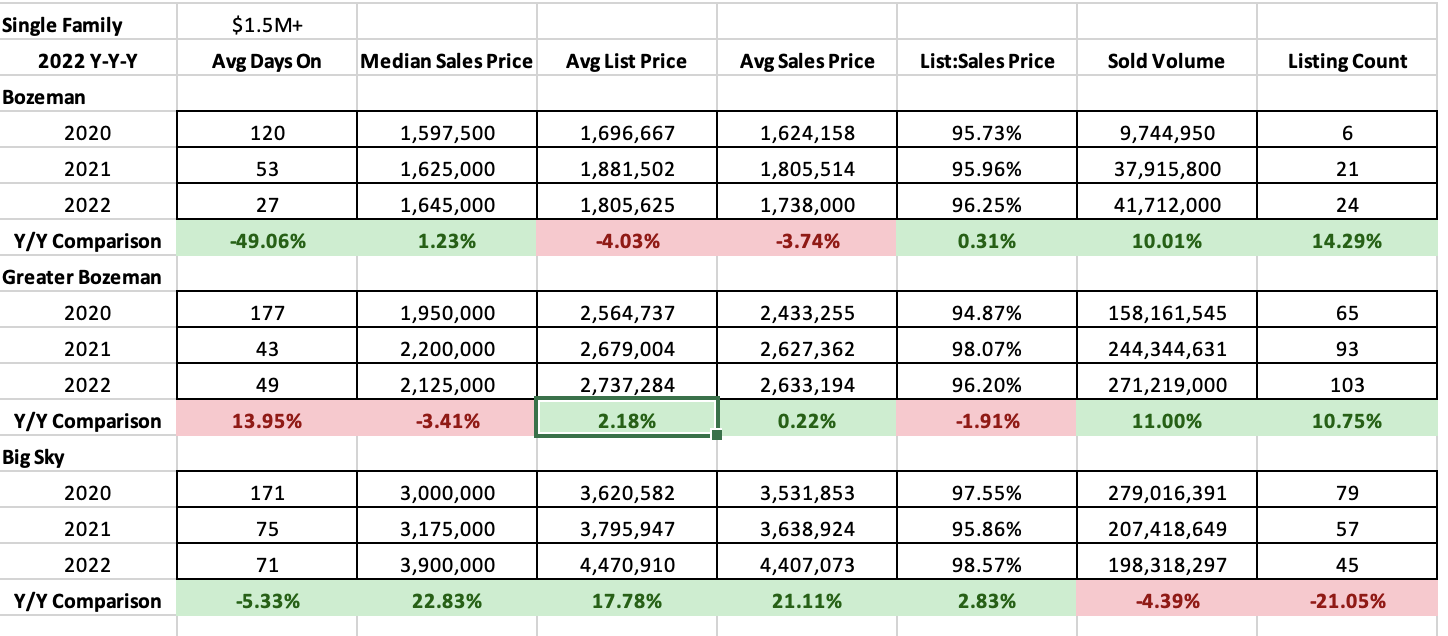
Luxury ($1.5M+) homes saw slight median sales price gains in City of Bozeman (1%) and slight declined in Greater Bozeman (down 3%). Big Sky rocketed with a 23% median sales price gain in luxury homes. List to sales price ratios showed about 4% on average discounting in City of Bozeman and Greater Bozeman and 1.5% in Big Sky. Days on market were down in City of Bozeman (1 month) and Big Sky (2 months) and they were about flat in Greater Bozeman (1.5 months). The speed of luxury property movement is quite striking – down from almost 4-6 months in 2020. Number of listings sold were up in City of Bozeman (24 homes sold) and Greater Bozeman by 10-14% (103 homes sold). Big Sky was off 2021 numbers with a 21% decline (45 homes sold).
Condo & Townhomes
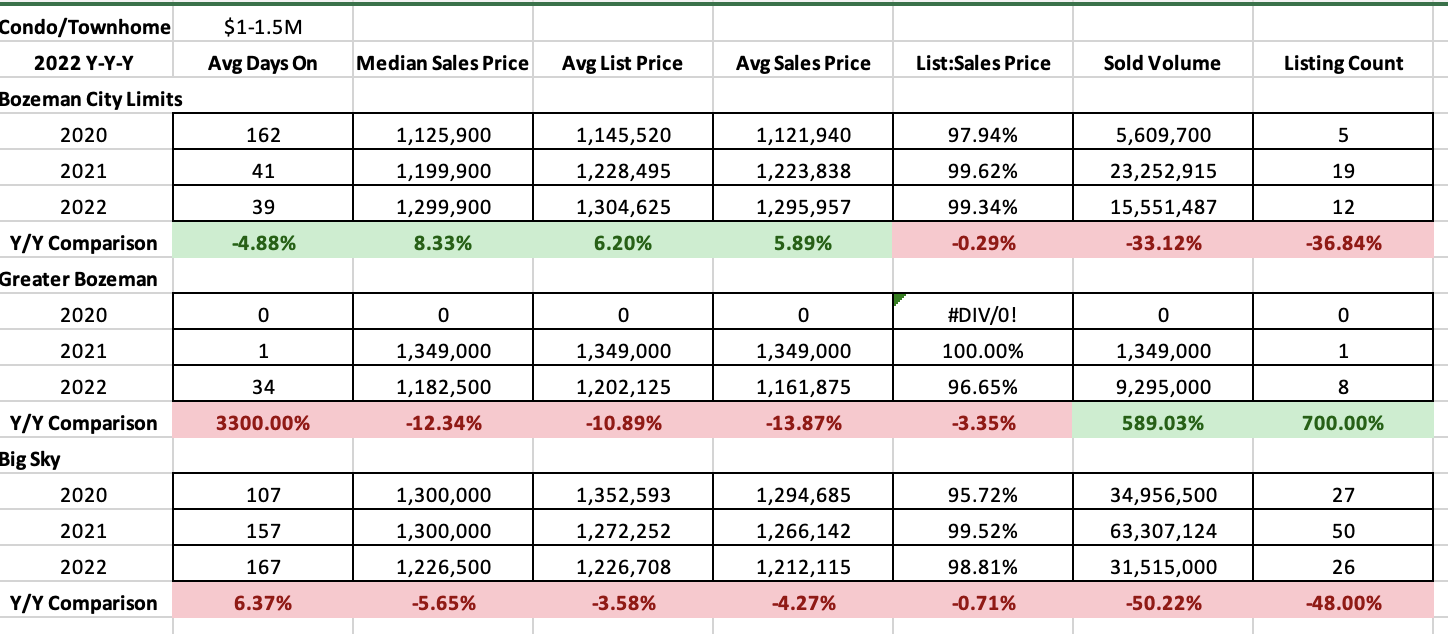
High end ($1M-$1.5M) condos and townhomes saw median sales price increase of about 9% in the City of Bozeman market and a drop of 5-12% in Greater Bozeman and Big Sky. List to sales price ratios showed less than 1% discounting on average for City of Bozeman, about 3% in Greater Bozeman and 1.2% in Big Sky. Interestingly, Greater Bozeman had almost no sales for high end condos and townhomes prior to 2022. Average days on market were down in City of Bozeman to just over a month but crept up in Greater Bozeman to just over a month and also up in Big Sky year over year at about 6 months. Number of listings sold declined 35% in City of Bozeman (12), were up 7 fold in Greater Bozeman (8) and down 48% in Big Sky (26)
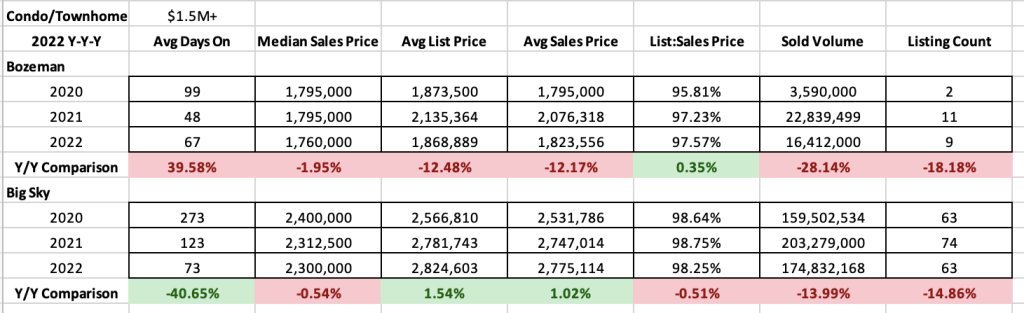
Luxury ($1.5M+) condos and townhomes saw median sales price stay flat in both City of Bozeman and Big Sky. List to sales price ratios showed about 2.5% discounting in City of Bozeman and 1.75% discounting in Big Sky. Average days on market were up to just over 2 months in City of Bozeman and down in Big Sky to 2.5 months. Number of units sold were off slightly in City of Bozeman (9) from 2022 and down 15